
Over the past several years, cryptocurrency has evolved from a niche activity into a more visible part of the digital economy. Although crypto-related purchases remain a small component of consumer payments, digital assets have become more relevant as digitally native commerce has expanded. This raises an important question: do consumers who regularly purchase cryptocurrency exhibit different debit behaviors than similarly active debit cardholders? Understanding those patterns can provide insight into a small cohort at the intersection of payments innovation and digital commerce.
This report uses internal Visa data for the U.S. market to examine Frequent Crypto Buyers across spending, transaction frequency, digital commerce, market segments, and geography. The findings suggest that this cohort is small in aggregate but highly active across several dimensions of debit usage.
This report focuses on “Frequent Crypto Buyers,” defined as users who made more than five crypto-related transactions in a quarter using a Visa credential between Q2 2023 and Q1 2026. Their broader debit behavior is compared with an activity-adjusted benchmark: U.S. debit cardholders who made more than five purchases in a given quarter, regardless of merchant category. Frequent Crypto Buyers accounted for approximately 0.03 percent of total U.S. debit card issuing payment volume over the period studied, making the cohort small but analytically distinct.
These differences should be interpreted with caution. Because the analysis is based on debit card transactions, it does not account for income, wealth, age, education, household composition, or other cardholder characteristics. The observed differences may therefore reflect who these cardholders are, not only behavior associated with crypto purchasing. The findings are descriptive and should not be read as causal explanations.
Elevated activity among a small debit cohort
Although Frequent Crypto Buyers represented a very small share of U.S. debit card issuing payment volume, their per-card spending was materially higher than the activity-adjusted benchmark throughout the period studied.
From Q2 2023 to Q1 2026, spend per active card among Frequent Crypto Buyers ranged from 2.96x to 3.73x the activity-adjusted benchmark. The ratio peaked in Q3 2024 before moderating, but still ended the period at roughly three times the level observed for comparable high-activity debit cardholders (see Figure 1).
Figure 1: Ratio of spend per active card for Frequent Crypto Buyers compared to activity-adjusted U.S. debit cardholders
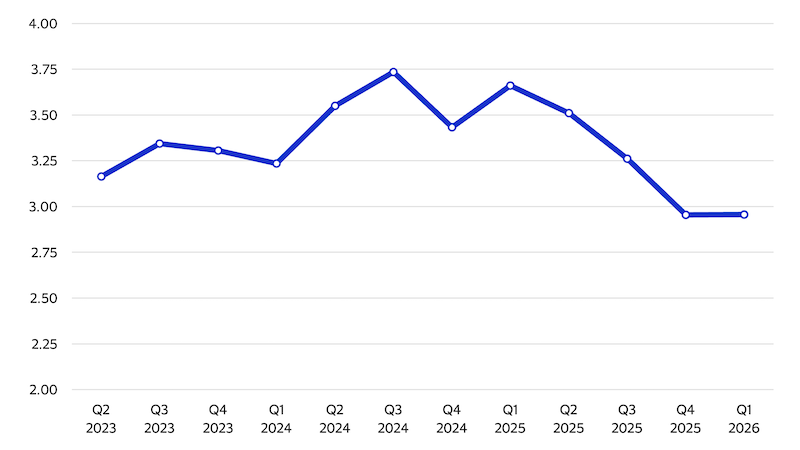
Figure 2: Ratio of debit card transactions for Frequent Crypto Buyers compared to activity-adjusted U.S. debit cardholders
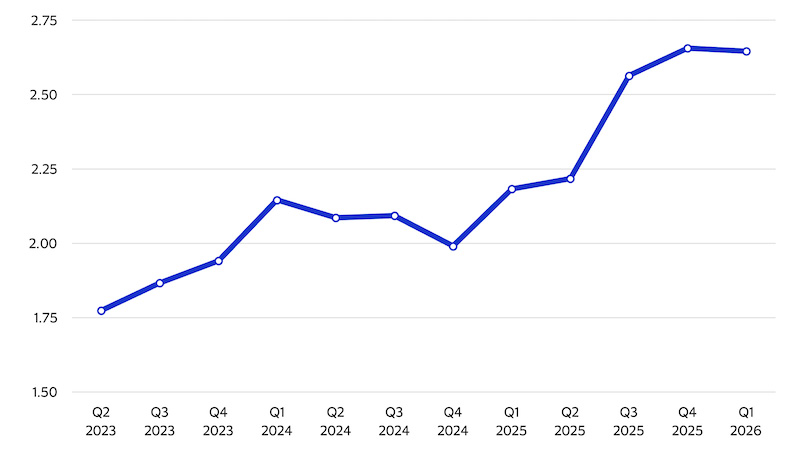
Together, these patterns suggest that Frequent Crypto Buyers are not simply making larger purchases; they are also using debit more often. Their elevated spending and transaction frequency point to broader debit engagement rather than occasional large-dollar activity.
This elevated activity provides the backdrop for another defining feature of the cohort: how and where these debit transactions take place.
A more digitally oriented debit profile
The clearest behavioral difference is Frequent Crypto Buyers’ greater reliance on card-not-present activity. Across every quarter in the sample, card-not-present transactions accounted for a larger share of their activity than among comparable high-activity U.S. debit cardholders.
Figure 3 reports Frequent Crypto Buyers’ card-not-present transaction share as a ratio to the corresponding share for the activity-adjusted benchmark. From Q2 2023 to Q1 2026, that ratio remained relatively stable, ranging from 1.44x to 1.52x. This indicates that their transaction mix was consistently more tilted toward card-not-present channels, even after accounting for baseline purchase activity.
Figure 3: Ratio of card-not-present transaction share for Frequent Crypto Buyers compared to activity-adjusted U.S. debit cardholders
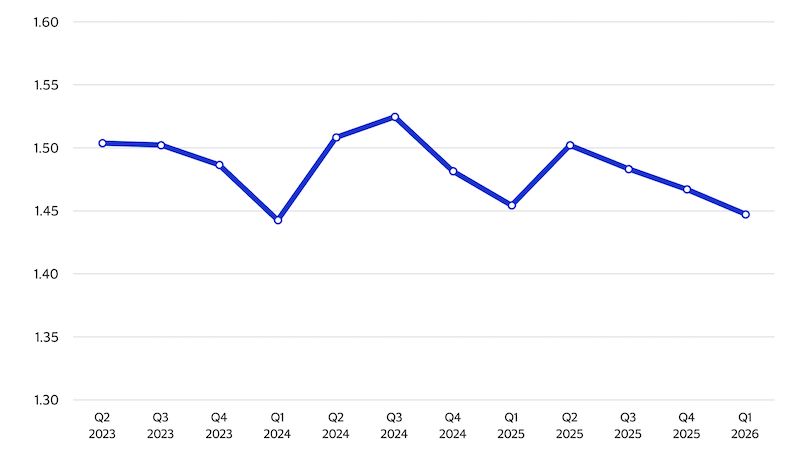
The stability of this ratio is notable. Unlike spend and transaction frequency, which moved more visibly over the period, the card-not-present ratio stayed within a narrow band. This suggests that Frequent Crypto Buyers’ greater digital orientation was a persistent feature of their debit usage.
Cross-border e-commerce and card-not-present spending show an even larger gap. Frequent Crypto Buyers spent substantially more per active card in this segment than the activity-adjusted benchmark. The ratio was 17.57x in Q2 2023, peaked at 24.39x in Q3 2024, and declined to 13.36x by Q1 2026 (see Figure 4). Even after moderating, the gap remained sizeable.
These results point to digital intensity as the cohort’s most durable distinction. Frequent Crypto Buyers remained more active in card-not-present environments, and their cross-border e-commerce and card-not-present spend per active card stayed well above the benchmark throughout the period.
Figure 4: Ratio of spend per active card on cross-border e-commerce and card-not-present transactions for Frequent Crypto Buyers compared to activity-adjusted U.S. debit cardholders
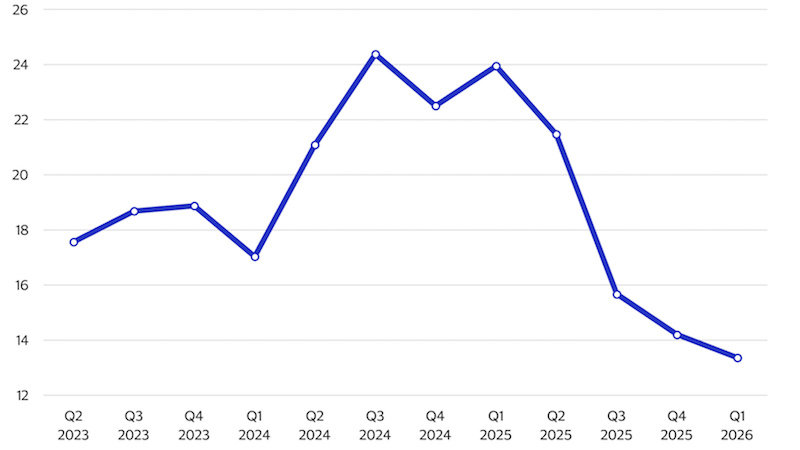
Figure 5: Ratio of cards active in cross-border card-present transactions for Frequent Crypto Buyers compared to activity-adjusted U.S. debit cardholders
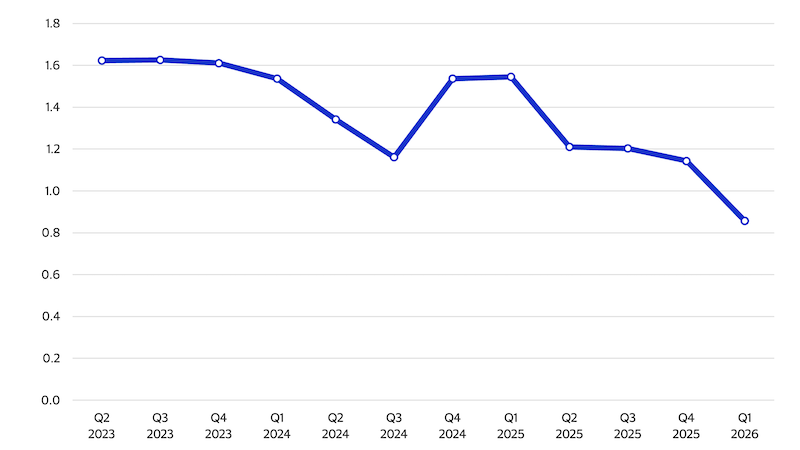
This decline shows that not every behavioral difference widened or persisted. Frequent Crypto Buyers remained highly distinct in card-not-present activity, but became less distinct in cross-border in-person usage and were below the benchmark by the end of the period. Their differentiation appears more strongly tied to digitally enabled remote commerce than to in-person international activity.
Category patterns point to concentrated differences
Higher spend per active card was not evenly distributed across categories. In Q1 2026, the largest differences were concentrated in a few segments rather than spread uniformly across the activity-adjusted benchmark.
The largest gap was in entertainment, where spend per active card among Frequent Crypto Buyers was 6.53x the activity-adjusted benchmark. Frequent Crypto Buyers also spent substantially more in business-related segments, at 3.27x, and retail, at 2.99x (see Table 1).
Table 1: Ratio of spend per active card on various market segment categories for frequent crypto buyers compared to activity-adjusted U.S. debit cardholders (Q1 2026)²
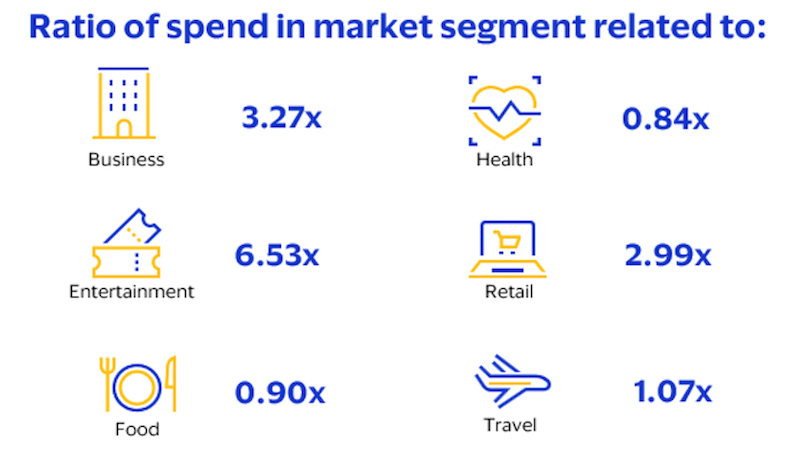
Other categories were much closer to the benchmark. Travel was only modestly higher, at 1.07x, while food and health were below the benchmark, at 0.90x and 0.84x, respectively.
The category data adds nuance to the broader finding that Frequent Crypto Buyers spend more. Entertainment, retail, and business-related categories stand out, while everyday or necessity-oriented areas such as food and health show no spending premium.
As with the broader results, these category differences may reflect cardholder characteristics, not only behavior associated with crypto purchasing. Still, the data sharpens the cohort’s profile: higher spend is more pronounced in discretionary, digitally enabled, or business-service-oriented segments than across merchant types generally.
Growth was broad, but uneven across states
The geographic data shows that overall debit activity among Frequent Crypto Buyers—not just crypto-related transactions—expanded across much of the U.S. from Q1 2025 to Q1 2026, though growth varied by state. This section examines two measures: payment volume, defined as the U.S. dollar value of transactions, and transaction volume, defined as the number of transactions.
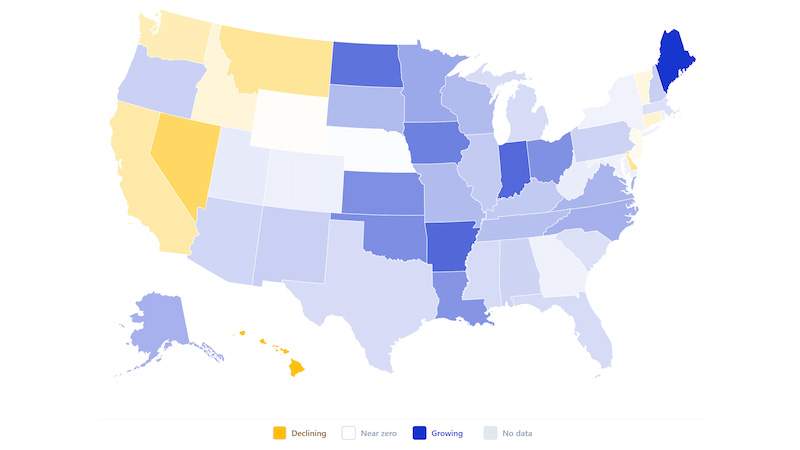
For payment volume, Frequent Crypto Buyers in most states recorded growth in Q1 2026 compared with Q1 2025. The strongest increases were in Maine (197 percent), Arkansas (148 percent), Indiana (147 percent), North Dakota (137 percent), and Iowa (124 percent). Several additional Midwest and Southern states also recorded payment volume growth above 100 percent.
A smaller set of states recorded declines, led by Hawaii (-77 percent), Nevada (-49 percent), Delaware (-34 percent), Montana (-32 percent), and California (-27 percent). These declines show that national growth was not evenly distributed across the country (see Map 1).
Map 1: Payment volume growth by state for Frequent Crypto Buyers (Q1 2025 to Q1 2026)
Map 2: Transaction volume growth by state for Frequent Crypto Buyers (Q1 2025 to Q1 2026)
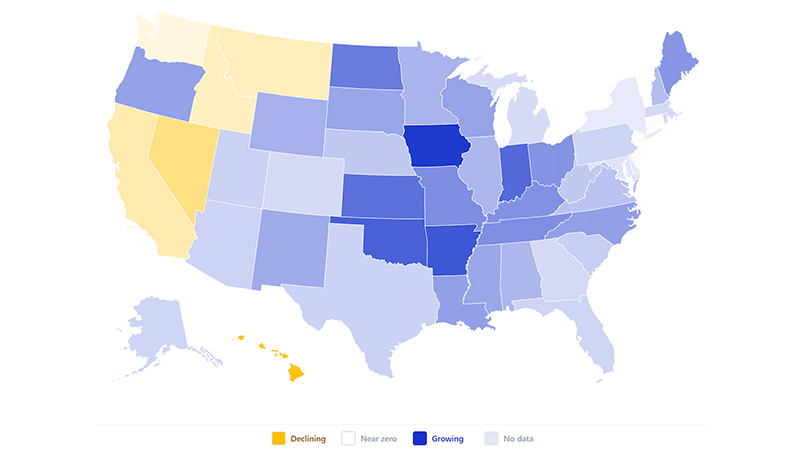
Two patterns emerge. Transaction growth generally outpaced payment volume growth, reinforcing the broader finding that Frequent Crypto Buyers became more transaction intensive. Growth was also not simply a coastal or large-market story; many of the highest-growth states were in the Midwest and South.
The maps reinforce one of the report’s central themes: Frequent Crypto Buyer activity grew sharply in many parts of the country, especially in transaction counts. The geographic pattern was broad, but not uniform.
Conclusion
Frequent Crypto Buyers represent a very small share of total U.S. debit card payment volume, yet their debit patterns differ meaningfully from the activity-adjusted benchmark. They spend more per active card, transact more often, and have a transaction mix more tilted toward card-not-present channels. Their higher spending is also concentrated in specific categories—particularly entertainment, business-related segments, and retail—rather than evenly distributed across merchant types.
The most persistent distinction is digital intensity. Across the period studied, Frequent Crypto Buyers’ card-not-present transaction share remained about 1.4x to 1.5x the benchmark, while cross-border e-commerce and card-not-present spend per active card stayed much higher despite moderating in recent quarters. At the same time, not every distinction persisted: cross-border card-present activity declined and fell below the benchmark by Q1 2026. Geographic growth was broad but uneven, with transaction growth generally outpacing payment volume growth.
Beyond profiling a specific cardholder segment, these findings show how emerging payment cohorts can differ from carefully constructed benchmarks. Although the analysis does not explain or opine on what drives these patterns, it suggests that tracking such cohorts can help policymakers, merchants, and banks better understand consumer activity across the U.S. economy.
Endnotes
- Cross-border card-present transactions capture in-person purchases where the cardholder uses a card issued in one country at a merchant located in another country. For example, a cardholder using a U.S.-issued card at a physical merchant location in France would fall into this category.
- The market segments described above combine data from various categories. Specifically, the breakdown is as follows: Business: Business to Business, Professional Services, Telecom/Utilities; Entertainment: Entertainment; Food: Food & Grocery, Quick Service Restaurant, Restaurants; Health: Drug stores & Pharmacies, Healthcare, Insurance; Retail: Apparel & Accessories, Department Stores, Discount Markets, Electronics, Online Marketplaces, Retail Goods, Retail Services; Travel: Airlines, Automotive, Fuel, Lodging, Transportation, Travel Services, Vehicle Rental.