
Overview
Community banks and credit unions are essential sources of financial services for individuals and businesses across the United States. Recent research indicates that the presence of community financial institutions (FIs) is associated with positive outcomes for small business performance and other local economic factors, especially in the face of adverse shocks.¹
Our research builds on existing literature by leveraging a new measure of community FI presence and exploring its relationship with small business health (measured in terms of revenue) in U.S. counties during the COVID-19 pandemic. While past studies have largely utilized data on community FIs’ share of branches or deposits, we instead use their share of payment volume (PV), defined as the dollar value spent using Visa credit and debit cards at merchants in each county.
Utilizing data from 740 U.S. counties during the first half of 2020, we find that areas with the greatest pre-pandemic community FI presence experienced a milder downturn in small business revenue, in addition to a quicker recovery. Moreover, we find that community FIs’ positive relationship with small business revenue appears strongest in low-income urban counties. These findings contribute to the growing body of evidence indicating that community FIs serve as important sources of stability for small businesses in times of economic uncertainty, especially those operating in underserved areas.
Community FIs and mission-driven lenders
The universe of community FIs and mission-driven lenders includes several distinct and overlapping groups. In this article, we focus primarily on banks and credit unions. While banks are for-profit entities owned by shareholders, credit unions are not-for-profit and member-owned.² Notably, banks and credit unions are also regulated and insured by different federal agencies. While federally chartered banks are regulated by the Federal Deposit Insurance Corporation (FDIC), the Office of the Comptroller of the Currency (OCC), or the Federal Reserve, federal credit unions are regulated by the National Credit Union Administration (NCUA). Depending on their market area, however, many community FIs opt for a state charter—meaning they are regulated at the state level.
The Federal Reserve defines community banks as those with a total asset size below $10 billion.³ However, definitions vary across different sources. While the FDIC’s 2020 study of community banks employs an indexed size threshold of $1.65 billion, the OCC’s newly announced community banking supervisory group will cover institutions up to $30 billion.⁴ In the context of this study, we define community FIs as those that meet one of two criteria: (1) an asset size of less than $10 billion or (2) an average asset size of less than $1 billion over the past three years.
Nationally, community FIs make up a small share of PV when compared to larger institutions. Figure 1 displays the distribution of PV made on cards issued by community FIs among the 740 U.S. counties included in our sample. As of January 2020, roughly half of counties observed less than 15 percent of PV made on cards issued by community FIs. During the same period, less than two percent of counties observed over 50 percent of their payment volume made on cards issued by community FIs.
Figure 1: Distribution of community FI presence (Jan. 2020)
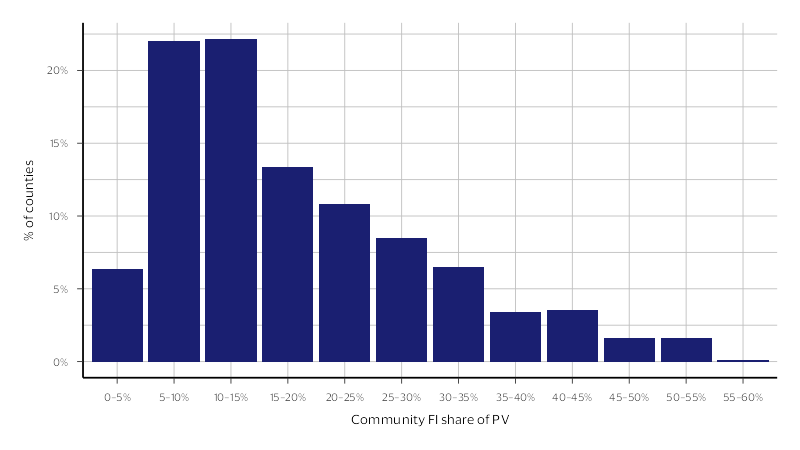
The presence of community FIs also differs by population density and region. Historically, both community banks and credit unions are more prevalent in rural areas (i.e., those with lower population density).⁵ In terms of region, we find that cards issued by community FIs make up the greatest share of PV in the Midwest, at roughly 22 percent. In the Northeast, Southeast, and West, community FIs account for between 16 and 18 percent of PV. This is consistent with existing research, which finds that community banks account for the greatest share of total branches in the Midwestern region.⁶
Many community banks and credit unions are also mission-driven lenders: FIs that align their lending with specific social, environmental, or other mission-based goals. The FDIC and NCUA designate specific types of mission-driven lenders, including Community Development Financial Institutions (CDFIs) and Minority Depository Institutions (MDIs). CDFIs are defined as institutions that “share a common goal of expanding economic opportunity in low-income communities by providing access to financial products and services.”⁷ MDIs, by contrast, are defined as institutions whose ownership (in the case of banks) or membership (in the case of credit unions) comprises a majority of individuals who fall into an eligible minority group.⁸ Typically, MDIs are also located in majority-minority communities and serve many minority customers. In some cases, institutions may be designated as both a CDFI and MDI.
Existing research has highlighted the important role that community banks, credit unions, and mission-driven lenders play in supporting the financial wellbeing of individuals and businesses. Recent studies have found that the presence of MDIs is associated with higher homeownership rates among low-income individuals and modest declines in alternative credit inquiries (e.g., payday loans).⁹ Research has also linked the presence of CDFIs to increased entrepreneurship among underrepresented groups—a useful indicator of local economic health.¹⁰
Beyond designated mission-driven lenders, community banks have also proven to be important sources of financial stability, especially during adverse economic shocks. Authors Petach et al. (2021) find that counties with greater community bank presence experienced smaller declines in employment and new business births during the Great Recession.¹¹ Additionally, authors Levine et al. (2021) find that counties with greater community bank presence experienced smaller declines in employment and small business revenue in response to COVID-19 infections—using the same outcome variable employed in our analysis.¹² The authors also find that community banks increased their small business lending by more than non-community banks in response to COVID-19, suggesting that smaller institutions are uniquely suited to provide liquidity to small businesses during economic shocks. Indeed, studies have also found that community FIs and mission-driven lenders played an outsized role in Paycheck Protection Program (PPP) lending during COVID-19.¹³
Community FIs and small business health during COVID-19
To explore the relationship between community FI presence and small business health during the COVID-19 pandemic, we leverage data from 740 U.S. counties representing 49 states and the District of Columbia. As a proxy for small business health, we use the weekly percentage change in seasonally-adjusted small business revenue relative to January 2020. We obtained data on small business revenue from the Economic Tracker, a resource compiled by researchers at Opportunity Insights that traces the economic impacts of COVID-19.¹⁴
To estimate the presence of community FIs, we use their pre-pandemic share of PV, defined as the dollar value spent using Visa credit and debit cards at merchants within each county during January 2020. This sets our analysis apart from existing research, which has largely used branches and deposits to estimate the presence of community FIs. While branches and deposits both serve as suitable proxies, we believe that PV represents a unique and effective measure of community FI presence. Unlike other proxies, PV helps capture the extent to which community FIs are involved in enabling commerce by issuing payment cards to individuals and businesses.
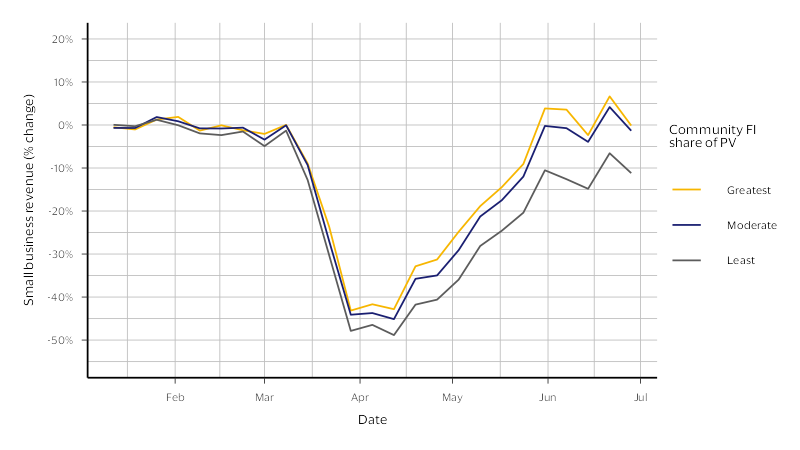
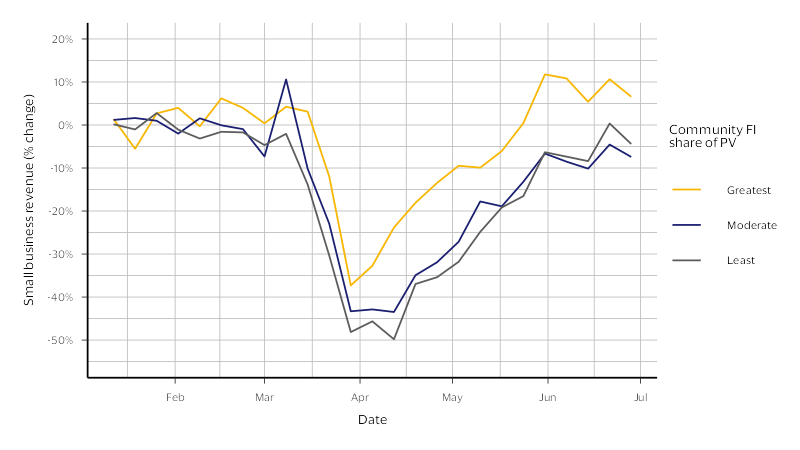
Figure 2 displays the weekly percentage change in small business revenue from January to June 2020 across three county groups. These groups are divided according to the presence of community FIs—as identified based on their share of PV—each representing one third of the counties in our full sample.¹⁵ As Figure 2 illustrates, we find that counties with the greatest community FI presence observed a milder downturn in small business revenue, in addition to a quicker recovery. During the week of April 6, small business revenue was down 42.8 percent in counties with the greatest community FI presence, compared to 48.8 percent in counties with the least presence. By the week of June 15, small business revenue was up 6.6 percent in counties with the greatest community FI presence, and down 6.6 percent in counties with the least. These findings appear to suggest that the presence of community FIs helped to mitigate the impact of COVID-19 on overall small business health during the early days of the pandemic.¹⁶
Figure 2: Small business revenue by community FI presence (Jan. - Jun. 2020)
Urban and rural counties
As noted previously, community FIs tend to have a greater presence in rural areas. To help ensure that our measure of community FI presence does not merely serve as a proxy for rurality—and therefore the intensity of COVID-19 spread—we also divide our analysis by urban and rural counties.¹⁷ While urban counties make up 460 of the 740 observations in our full sample (around 62 percent), rural counties account for 280 observations (around 38 percent).
As illustrated in Figure 3, our findings appear to hold in both urban and rural areas. Additionally, the positive relationship between community FI presence and small business revenue appears stronger in urban counties. Among rural counties, small business revenue fell by 43 percent in those with the greatest community FI presence and 47 percent in those with the least. Among urban counties, this gap is even wider; small business revenue fell by only 41.6 in counties with the greatest community FI presence, and 50.4 percent in those with the least. Given community FIs’ history of serving rural areas, the possibility that their relationship to small business revenue may be stronger in urban areas is notable—a subject we expand upon in the following section.
Figure 3: Small business revenue by community FI presence (Jan. - Jun. 2020): Rural and urban counties
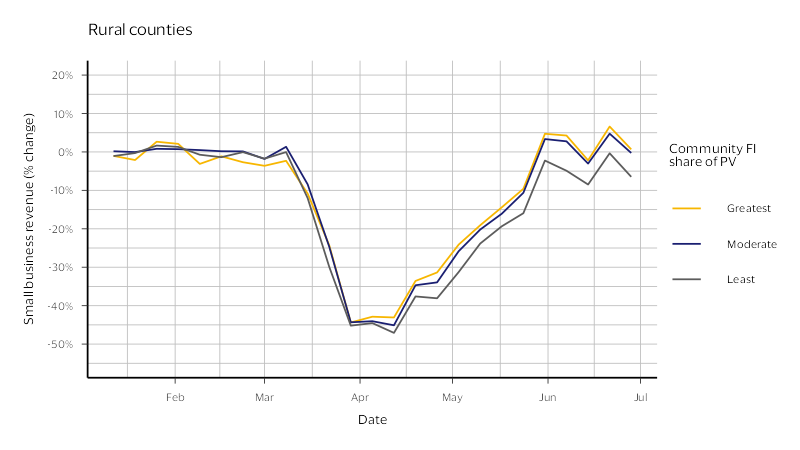
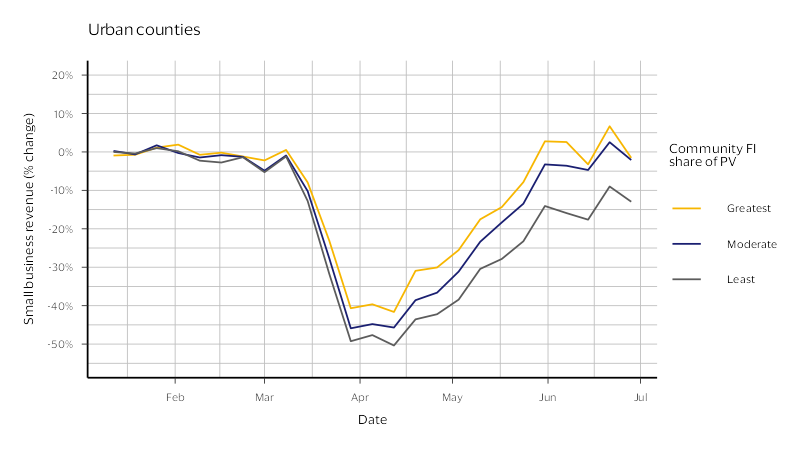
Figure 4: Small business revenue by community FI presence (Jan. - Jun. 2020): Low-income urban counties
Discussion
Our results suggest that counties with greater community FI presence experienced a milder downturn in small business revenue during the early days of COVID-19, in addition to a quicker recovery. This finding is consistent with recent research on the lending practices of community FIs and their relationship with the small business community. Not only did community FIs play an outsized role in providing PPP loans during the pandemic, but they also increased their small business lending by more than non-community FIs in response to COVID-19.¹⁸ One factor that may help explain these findings is community FIs’ tendency toward a relationship-based banking model. Given their smaller scale and local focus, community FIs often have close connections to their customers or members, allowing them to go beyond traditional credit scoring and use soft information when making lending decisions.¹⁹
Our results also suggest that the relationship between community FI presence and small business revenue during COVID-19 was strongest in low-income urban areas. This finding may have several explanations including—but not limited to—the demographics present in these areas and types of small businesses located there. That said, our findings in urban areas stand in contrast to past studies illustrating the positive outcomes associated with community FIs in rural areas. This discrepancy likely results from a combination of factors, including outcome variables and levels of analysis. Rather than leveraging revenue as a proxy for small business health, Mencken et al. (2023) use new business formations, finding a positive association with the concentration of “locally owned” banks in non-core and micropolitan areas, but not metropolitan areas.²⁰ Their analysis also covers a different study period (1980-2010) and uses a different level of analysis: commuting zones, or groups of counties identified based on commute-to-work patterns. Given these discrepancies, additional research is required to assess the extent to which community FIs’ role in urban and rural areas may be evolving.
Conclusion
In the United States, small businesses employ 45.9 percent of the total workforce and account for 43.5 percent of total GDP.²¹ New business applications have reached record numbers in recent years—totaling 5.5 million in 2023.²² Given their limited scale, however, small businesses are especially vulnerable to economic shocks like those caused by the COVID-19 pandemic.
Our research suggests that community FIs serve as important sources of stability for small businesses in times of economic uncertainty, especially those operating in underserved areas. Looking ahead, public and private sector stakeholders interested in promoting small business health and resilience should consider the role that community banks and credit unions play in supporting them.
Footnotes:
- Levine, R., Lin, C., & Xie, W. (2021, June). Local Financial Structure and Economic Resilience (Working Paper). World Bank Group; Petach, L., Weiler, S., & Conroy, T. (2021, May). It’s a wonderful loan: local financial composition, community banks, and economic resilience. Journal of Banking & Finance 126.
- National Credit Union Administration (NCUA). (2025, June 17). Overview of Federal Credit Unions.
- Board of Governors of the Federal Reserve System. (2025, July 31). Community & Regional Financial Institutions.
- FDIC. (2020, December). FDIC Community Banking Study; OCC. (2025, September 18). OCC Announces Updates to Organizational Structure.
- Advancing Communities. (n.d.). Rural Communities; FDIC (2020)
- FDIC (2020)
- CDFI Fund. (n.d.). What are CDFIs?
- FDIC (2021, March 3). FDIC Definition of Minority Depository Institution; NCUA. (2025, June 23). Minority Depository Institutions.
- Levy, J., Batbold, D., Chukwuma, A., Ferreira Cardoso, C., He, M., Lung, R., & Xia, S. (2024, June). Minority Depository Institutions (MDIs): Examining their support for low-income homeowners and the implications for underserved communities. Visa Economic Empowerment Institute; Pietro, E., & Barr, A. (2025, August 27). Credit in Context: Profiling Alternative Lending Use in MDI Communities. National Bankers Association.
- Johnson, E. E., Lanahan, L., Joshi, A. M., & Hemmatian, I. (2025, August). The Role of Community Development Financial Institutions in Supporting Inclusive Economic Development. Economic Development Quarterly 39(3).
- Petach et al. (2021)
- Levine et al. (2021)
- Cordova, C., Samowtiz, J., & Siems, T. F. (2020, December 11). Community Banks Play Outsized Role in PPP Lending. Conference of State Bank Supervisors; Barr, A., & Romer, C. (2023, August 30). Minority Depository Institutions: Paycheck Protection Program (PPP) Lending Insights. National Bankers Association.
- Small businesses defined as those with 1-499 employees. See: Chetty, R., Friedman, J. N., Stepner, M., & the Opportunity Insights Team. (2023, July). The Economic Impacts of COVID-19: Evidence from a New Public Database Built Using Private Sector Data.
- Counties in the “least” category (i.e., the bottom tercile) include those where community FIs made up less than 10.9 percent of PV in January 2020. Counties in the “greatest” category (i.e., the top tercile) represent those where community FIs made up greater than 21.5 percent of PV. Terciles are recalculated for each figure.
- In addition to the graphical analysis presented here, the study team performed a regression analysis to the specifications of Levine et al. (2021). This analysis yielded statistically significant results (p < 0.001), finding that in response to COVID-19, small business revenue fell by less in counties with a greater share of PV made on cards issued by community FIs—even when including county and state-week fixed effects and controlling for county-level variables like population density and unemployment.
- We define urban counties as those located in metropolitan areas of over 250,000 residents, and rural counties as those located in non-metro areas or metro areas of fewer than 250,000 residents.
- Barr & Romer (2023); Cordova et al. (2020); Levine et al. (2021)
- Gruenberg, M. J. (2024, October 12). Remarks by Chairman Martin J. Gruenberg [Speech]. FDIC.
- Mencken, F. C., Carpenter, C. W., Lotspeich-Yadao, M., & Tolbert, C. M. (2023, September). Bank on it: Do local banks contribute to rural community prosperity? Rural Sociology 88(3).
- Melhorn, S. F., Hoover, M., & Lucy, I. (2024, May 20). Small Business Data Center. U.S. Chamber of Commerce; U.S. Small Business Administration Office of Advocacy. (2025). 2025 Small Business Profile.
- Melhorn, S.F., & Cates, L. (2024, February 2). Map: New Business Applications Surge Across the Country. U.S. Chamber of Commerce.