Introduction
Discussions about global fragmentation are on the rise. The topic has been highlighted by key international organizations like the International Monetary Fund (IMF), Group of 20 (G20), United Nations Trade and Development (UNCTAD), and Bank for International Settlements (BIS).¹ This increased focus is no surprise. Geopolitical and geoeconomic events over the past several years have prompted governments and industries to reassess risk and strategy around trade, finance, and security. A World Economic Forum report estimates fragmentation may cause up to $5.7 trillion in annual economic losses.²
What exactly do we mean by “global fragmentation”? Put simply, the term refers to a reversal of global integration in areas such as finance, technology, foreign direct investment, and trade.³ Trade data provides an especially useful framework for analyzing changes in cross-border economic relationships, helping us identify whether and how fragmentation dynamics may be reshaping the global economy. Accordingly, this paper examines the concept of global fragmentation through the lens of international trade in goods. By examining trade patterns over the past 20 years, we find that while aggregate global trade volumes have remained steady, the trade boom experienced in the early 2000s has given way to stagnation in the number of active trade partners and concentration of flows through a small number of high-value corridors.
Recent evolutions in global merchandise trade
To trace recent changes in the global trade network, we use bilateral merchandise trade data for 197 economies during the two decades beginning in 2004 and ending in 2023.⁴ During this period, we emphasize two dimensions of global trade: the extensive margin (how many corridors exist and how often they are created or discontinued) and the intensive margin (whether trade within existing corridors is growing or shrinking). For each dimension, we discuss global patterns and highlight how they manifest in 16 East and Southeast Asian economies.⁵ We focus on this region because it is one of the most dynamic with respect to international trade.
Overall, the 2000s and 2010s were a period of rapid expansion in the global trade network. Measured as a share of all possible country pairs, active export corridors increased from roughly 43 percent in 2004 to 58 percent in 2017, while import corridors rose from 47 to 69 percent.⁶ Since 2017, however, this expansion has stalled. The share of active export and import corridors dipped during the COVID‑19 pandemic and, as of 2023, has yet to reach its previous peak (see Figure 1). Even if late‑reporting countries were to record trade with every possible partner—a highly unlikely outcome—the global share of active corridors would not change by more than one or two percent.
Figure 1: Share of active global export and import corridors, 2004-23
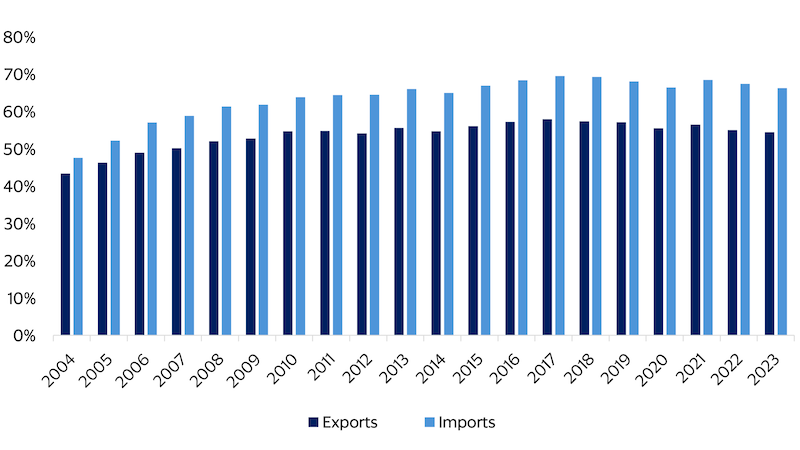
Figure 2: Share of active export and import corridors in East and Southeast Asia, 2004-23 (global vs. intraregional)
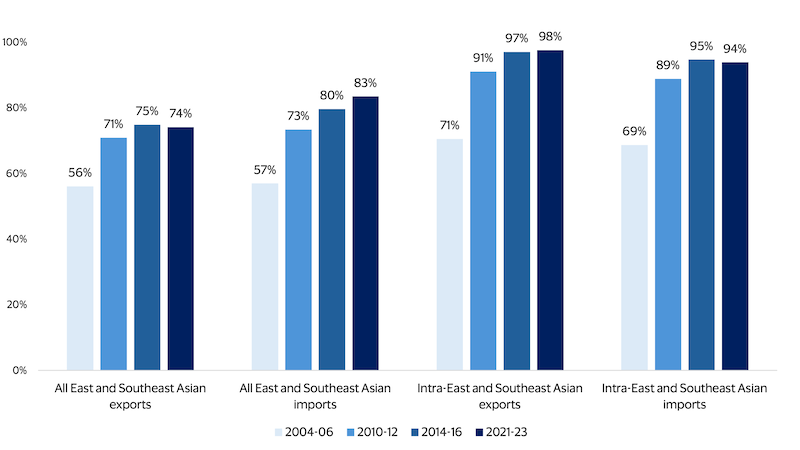
Figure 3: Global corridor birth and death rates, 2004-23
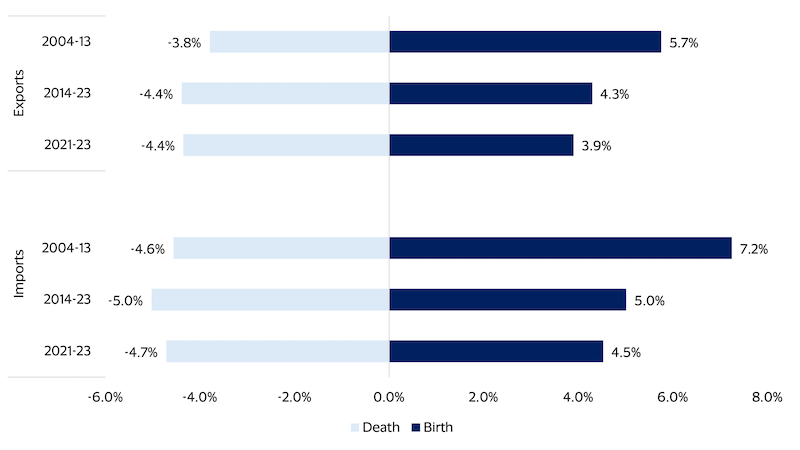
Figure 4: Average share of active corridors with growing trade flows in East and Southeast Asia, 2004-23 (global vs. intraregional)
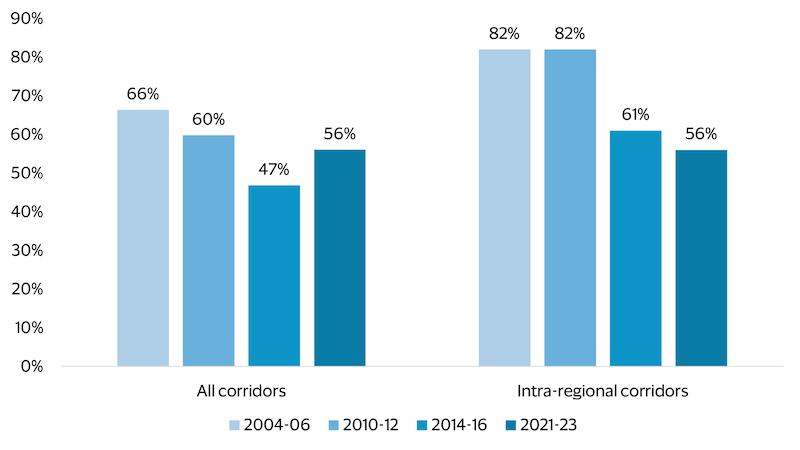
These changes in trade volumes have occurred in parallel to the concentration of flows through certain corridors. At the global level, trade has long been skewed toward a small set of corridors and countries, and this has not fundamentally changed. In 2004–06, roughly 1.4 percent of all possible export corridors accounted for 80 percent of world exports. By 2014–16, 1.8 percent of corridors carried the same 80 percent share—remaining steady through 2023. Similarly, the top 100 export corridors alone represented around 61 percent of world exports in 2004–06, falling to 56 percent in 2014–16 and rising slightly to 58 percent in 2021–23. At the country level, about 12 percent of economies generated 80 percent of world exports in 2021–23, compared with 11 percent in 2004–06, representing a modest diversification. In other words, while the number of active corridors has grown over the past two decades, the bulk of trade still runs through a relatively small set of large links between major traders.
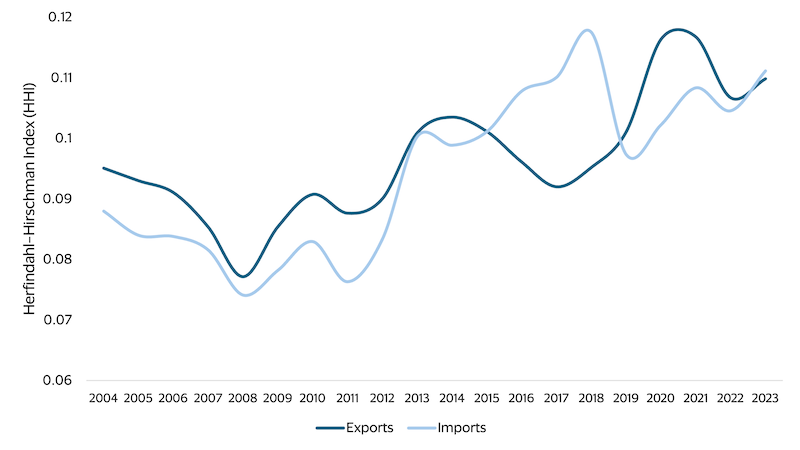
In East and Southeast Asia, trade flows have also become more concentrated. Most economies in the region have broadened their partner base since the early 2000s, yet many now send and receive a larger share of trade through a smaller group of partners. Vietnam’s exports, for example, have shifted toward Chinese and U.S. markets, while Mongolia’s exports have become more heavily oriented toward China. The Herfindahl‑Hirschman Index (HHI) is a widely used measure for concentration of markets that can also be used to measure the concentration of countries’ trade flows. A low HHI means the market is more diversified while a high HHI means the market is more concentrated. The median HHI for exports and imports in East and Southeast Asia has edged up since 2004, though levels remain relatively low—indicating diffuse trade by global standards (see Figure 5).
Figure 5: Median HHI for exports and imports in East and Southeast Asia, 2004-23 (smoothed)
Taken together, recent changes in the extensive and intensive margins of trade tell a consistent story. Over the past two decades, the world has moved from a period of rapid diversification to one in which the number of corridors has largely plateaued and a growing share of existing corridors see stagnant or declining flows. East and Southeast Asia—one of the world’s most dynamic trading regions—illustrate this shift clearly. Its network is extremely saturated, net corridor creation has slowed considerably, and trade flows are gradually concentrating into a core set of partners even as the region’s overall share in world exports continues to rise. While these trends are not necessarily indicative of fragmentation in a pure sense, stagnation in the number of corridors and concentration of trade flows may heighten the impacts of further geoeconomic fracturing.
Lessons learned from global merchandise trade
How might the stagnation of extensive margins and concentration of intensive margins impact the global economy down the line? Recent research suggests that firms and countries that diversify their export markets and product offerings tend to have more durable exports and better long‑run performance.⁷ Calculations based on the data analyzed here validate these findings and emphasize the importance of extensive margins: while countries that diversified their export partners between 2014 and 2023 observed strong export growth during the same period, those that concentrated their trade partners observed a slight contraction in overall exports. Taken together, these findings highlight that the way countries spread their trade across partners matters for their ability to weather shocks.
Countries that hope to mitigate risks of future fragmentation and promote economic resilience should consider how trade policy and other regulations might impact their ability to grow and maintain trade relationships. This includes digital and financial rules and standards that govern cross‑border transactions, which may also have the potential to impact firms’ access to new trading partners. For example, research from the eTrade Alliance finds that divergent data transfer policies have made it more difficult for micro and small businesses to diversify their export markets.⁸
Conclusion
While global trade volumes have remained broadly stable, the creation of new trade corridors has stalled since the mid‑2010s, and a growing share of existing corridors now experience stagnant or declining flows. The potential explanations for these trends are wide-ranging, including trade policy, rising national interests, economic shocks such as the COVID-19 pandemic, and increasing saturation of the global trade network. The impact of trade saturation is especially clear in East and Southeast Asia, where trade networks are highly integrated, leaving adjustment to occur primarily through changes in trade volumes and partner concentration.
For policymakers, these findings underscore that economies that continued to diversify their trade partners over the past decade performed better than those that became more concentrated, highlighting the importance of the extensive margin for resilience and growth. Sustaining a resilient global trading system may therefore require policies that enable reaching new markets—especially for smaller firms and economies—and prevent stagnation from developing into further fragmentation. Without such efforts, trade is likely to become more concentrated and less dynamic, increasing vulnerability to shocks even in regions that remain deeply integrated into global markets.
Footnotes:
- In the past several years, the IMF has held conferences explicitly focused on the economic consequences of geoeconomic fragmentation and written extensively on the topic. The G20 has recognized fragmentation as a key issue in its Roadmap for Enhancing Cross-border Payments. UNCTAD’s 2026 Global Trade Update frames geopolitical fragmentation as a central lens for understanding current trade patterns and policy debates. The Bank for International Settlements has discussed the topic in recent BIS reports and BIS speaking engagements.
- World Economic Forum. (2025, January). Navigating Global Financial System Fragmentation.
- Aiyar, S., Presbitero, A. F., & Ruta, M. (2023). Geoeconomic Fragmentation: The Economic Risks of a Fractured World Economy. IMF & Centre for Economic Policy Research.
- Data were obtained from the United Nations Comtrade Database.
- East and Southeast Asian economies include Brunei, Cambodia, China, Hong Kong, China, Indonesia, Japan, Korea, Lao PDR, Macao, Malaysia, Mongolia, Myanmar, Philippines, Singapore, Thailand, and Vietnam. This sample of countries was selected based on trade data availability.
- The difference between export and import corridors is driven largely by countries that failed to report their exports.
- See Tovar & Martinez (2011), United Nations (2022), and Volpe Martincus & Carballo (2009).
- Suominen, K., & Vambell, E. (n.d.). Toward an African Data Transfer Regime to Enable MSMEs’ Cross-border Ecommerce. eTrade Alliance.