
Productivity growth and the search for enabling technologies
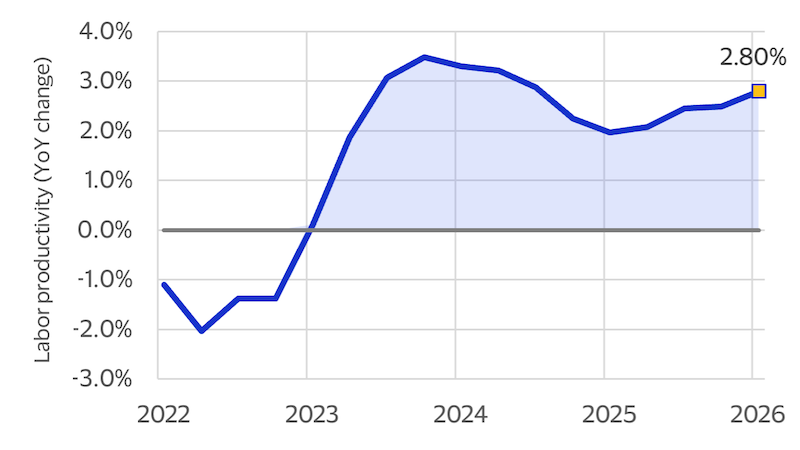
Interest in United States (U.S.) productivity growth has renewed as policymakers and business leaders navigate macroeconomic headwinds and rapid technological change. Artificial intelligence (AI), the buildout of digital infrastructure including data centers, and advances in chips and semiconductors have intensified discussion about the potential of new technologies to support sustained gains in business performance. In addition, U.S. labor productivity rose 2.8 percent year-over-year (YoY) in the first quarter of 2026, further fueling interest in how technology adoption may shape the future path of economic growth (see Figure 1).¹ While much of the current discussion centers on headline technologies such as AI, other productivity-enhancing innovations—including digital payments—fly under the radar.
Figure 1: U.S. labor productivity growth has strengthened in recent years
Digital payments as productivity-enhancing technologies
Digital payments are more than an alternative to cash. Today, payment systems are increasingly integrated with inventory management, accounting software, loyalty programs, digital recordkeeping, and customer analytics. As a result, digital payment adoption may be associated with productivity not only because of aspects like the speed of transactions, but because digital payments often form part of a broader package of technology-enabled business activities.
New research by authors Diniz, Cormier, Garcia-Swartz, Latham, and Tzanetaki finds that retailers that shifted more of their sales to digital payments get more output from the same workforce. Their study estimates that increasing the share of sales made through digital payments by 10 percentage points is linked to a 0.5 percent to 1.5 percent improvement in labor productivity.² As such, digital payments appear to be an important tool that help retailers operate more efficiently.
Why the geography of payment activity matters
Against this productivity backdrop, it is important to understand how digital payment activity is distributed. Technology adoption often occurs unevenly across geographies, with some locations serving as early adopters while others take hold at a different pace. If digital payments are associated with higher productivity, geographic differences in payment activity may provide context for understanding how labor productivity is evolving across the economy. Using depersonalized Visa card transaction data, we examine how national and state-level card payment volume per capita changed between 2023 and 2025. Rather than estimating productivity effects directly, the analysis documents where payment activity is focused and how its geographic distribution has evolved over time. This provides a descriptive overview of the diffusion of digital payments that prior research has associated with improvements in retail labor productivity.
The geography of payment intensity
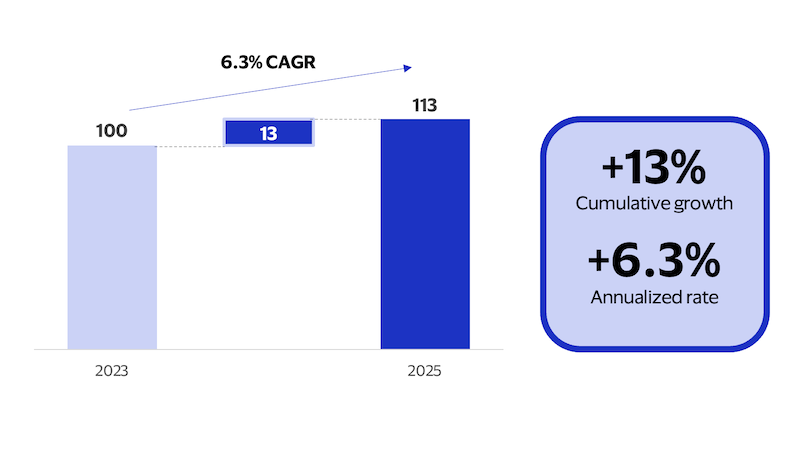
We use card payment data as a proxy to measure digital payments across the U.S. At the national level, we find from our analysis that U.S. card payment volume per capita expanded between 2023 and 2025. To make this growth easier to understand, we normalized national payment volume per capita to a starting value of 100 in 2023. By 2025, the index reached 113, indicating that payment activity increased 13.0 percent over the period, which was equivalent to an annualized growth rate of about 6.3 percent (see Figure 2). While the analysis does not identify the drivers of this growth, the results suggest that card payment activity became more intensive over the period.
Figure 2: Indexed card payment volume per capita growth, 2023-2025
We also want to better understand how much card payment activity occurs at the state level and how card usage varies across states. Between 2023 and 2025, state card payment volume per capita growth ranged from -2.5 percent to 76.3 percent. It’s important to note that Delaware and Wyoming are outliers in positive growth; in both states, growth appears to be related to a large increase in the number of merchants, especially concentrated in card-not-present activity, which could be consistent with their respective roles as major business-incorporation jurisdictions.³ To test whether these outliers drive the broader findings, we recalculated the national-level results excluding Delaware or Wyoming and found the U.S. growth rate was at 12.5 percent vs. the original 13 percent. This limited change suggests that the overall growth in the U.S. was not driven primarily by these outlier states and that the broader national pattern remains largely intact.
These growth rates tell us how quickly payment activity is changing, but it is not the most informative way to tell us whether that level is high or low relative to the broader U.S. economy. A simple method to determine this is to divide the state-level card payment volume per capita by the national average card payment volume per capita (i.e., a common benchmark). By expressing each state's level relative to the national average, we can create a payment intensity index that identifies differences across states to aid in interpretation and communication of the data.⁴ For our analysis, an index value of 1.00x indicates that a state is at the benchmark, >1.00x means it is above, and <1.00x is below.
Let’s illustrate this with an example. Imagine that in 2023 and 2025, State A had payment volume per capita of $5,000 and $6,000, respectively, and State B had $20,000 and $21,600, respectively. State A’s growth rate would be 20 percent while State B’s growth rate would be eight percent. State A appears to be the success story, but this aspect changes when we compare the state relative to the broader economy. If the national payment volume per capita was $15,000 in 2023 and $17,000 in 2025 then State A would have an intensity index of 0.33x and 0.35x while State B’s index would equal 1.33x and 1.27x. So, even though State A grew faster, it was well below the national average.
Using the Visa card payment data, we can visualize the payment intensity index for each state in 2023 and 2025 by creating five discrete groups: well below the benchmark is <0.85; below benchmark is 0.85-0.95; near benchmark is 0.95-1.05; above benchmark is 1.05-1.15; and well above benchmark is >1.15. The results show that payment volume per capita at the state level relative to our national level remains unevenly distributed across the U.S. For example, in 2023 and 2025, 36 and 37 states, respectively, had payment intensity below or well below the benchmark. By contrast, seven states were well above the benchmark in 2023, increasing to nine states with substantially higher per capita payment activity in 2025 (see Figure 3).⁵ This distribution highlights meaningful geographic differences in payment activity and suggests that the digital commerce landscape continues to vary across locations.
Figure 3: Payment intensity index remains dispersed across states in 2023 and 2025
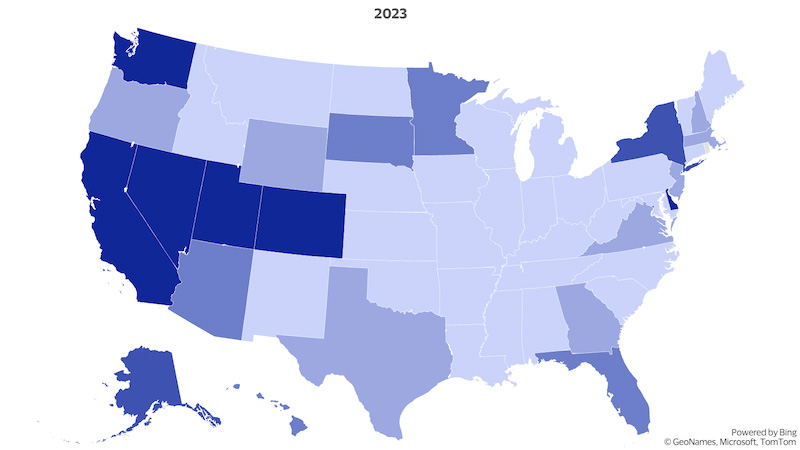
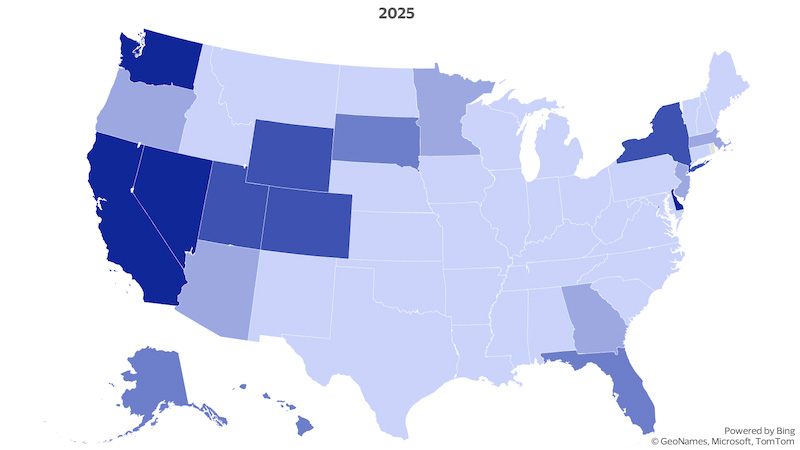
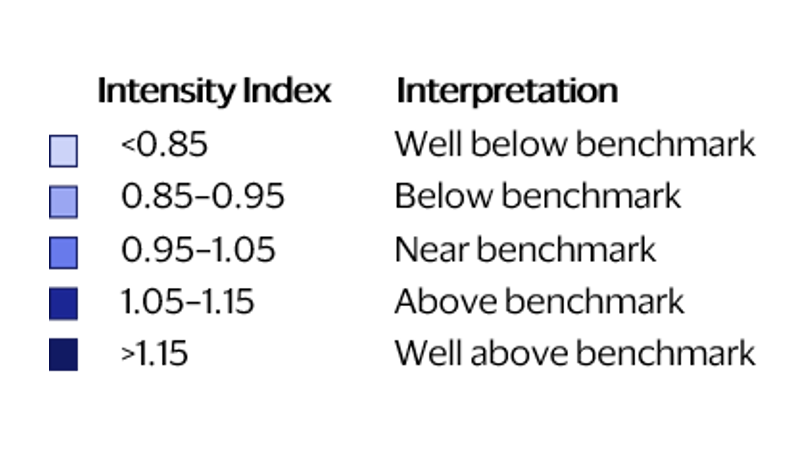
Figure 4: State-level intensity index counts (left) and average point change in intensity index (right), 2023-2025
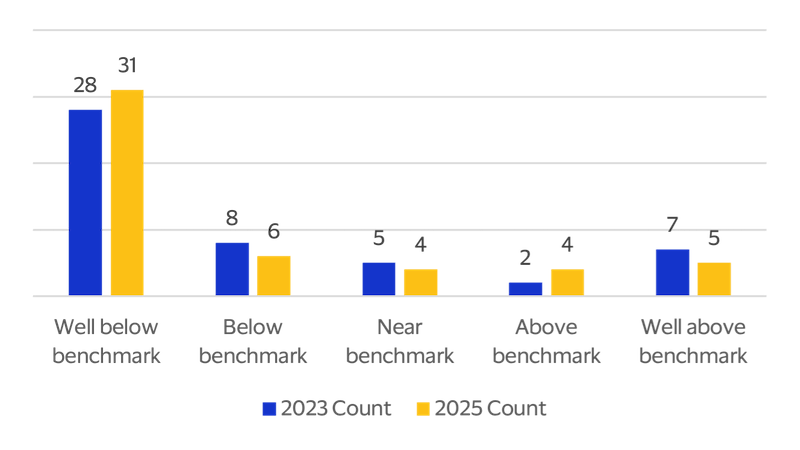
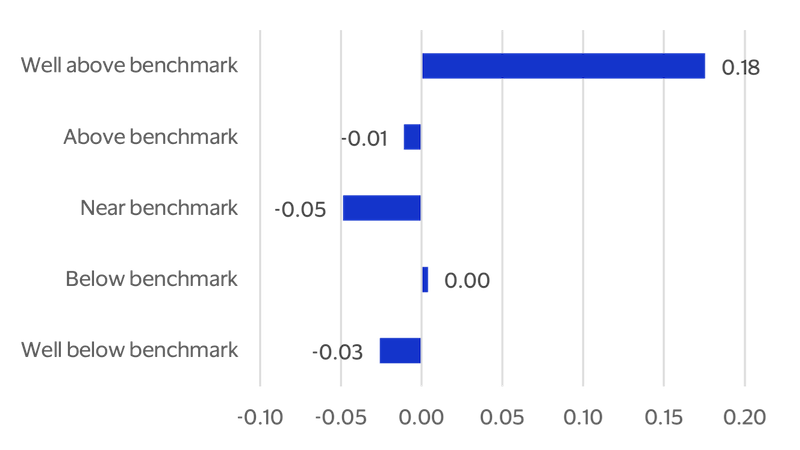
Taken all together, we see that digital payment activity continued to grow at the national level in the U.S. between 2023 and 2025, but growth remained uneven across states. The payment intensity index also varied substantially across locations with many states falling below the national benchmark value while relative gains were concentrated in a smaller subset of states.
What the findings suggest about technology diffusion
These findings offer a way to track how digital payments are becoming more geographically dispersed over time. The payment intensity index may also serve as an observable measure of local digital commerce activity, complementing traditional economic indicators. More broadly, geographic differences in payment intensity can help show how productivity-related technologies are distributed across states, providing a descriptive view of the nationwide distribution of a technology that prior research by Diniz et al. links to retail productivity.
At a time when policymakers, businesses, and economists are increasingly focused on productivity growth, digital transformation, and the adoption of new commerce technologies, understanding where payment activity is concentrated—and how those patterns are evolving—provides insight into differences in digital payment adoption and usage across states, while offering a useful perspective on the changing structure of the U.S. economy.
Endnotes
- VEEI reproduction of BLS analysis. BLS Productivity and Costs, First Quarter 2026, Revised.
- Diniz, Cormier, Garcia-Swartz, Latham, and Tzanetaki (2026). Digital Payments and Retail Productivity: An Exploration with a Panel of U.S. Retail Subsectors.
- CNP activity may reflect a mix of consumer demand, merchant location, legal domicile, merchant-of-record arrangements, or payment facilitation structures, and therefore may not map cleanly to local economic activity in the same way as card-present transactions.
- The underlying data observes Visa card payment volume rather than all digital payments or total retail sales, so we use a relative payment-intensity measure defined as state card payment volume per capita relative to a national card payment volume per capita level.
- This core pattern remains broadly intact even if we exclude Delaware and Wyoming.
- States are grouped by their 2023 payment-intensity category. The figure shows the average change in payment-intensity index between 2023 and 2025 for each group. Values above zero indicate that states in the group gained relative to the national benchmark, while values below zero indicate that states grew more slowly than the benchmark.
Disclaimer: Case studies, comparisons, statistics, research and recommendations are provided “AS IS” and intended for informational purposes only and should not be relied upon for operational, marketing, legal, technical, tax, financial or other advice. Visa neither makes any warranty or representation as to the completeness or accuracy of the information within this document, nor assumes any liability or responsibility that may result from reliance on such information. The Information contained herein is not intended as investment or legal advice, and readers are encouraged to seek the advice of a competent professional where such advice is required.