Overview
Small businesses are vital contributors to the United States (U.S.) economy, employing 62.3 million people and contributing 43.5 percent of gross domestic product (GDP).¹ They also serve as vehicles for economic mobility, allowing entrepreneurs to build wealth, create jobs, and contribute to the overall prosperity of their community.² However, small businesses operating in economically distressed areas may face challenges that others do not—like constrained local market conditions and limited access to trusted financial services.³
Prior research has examined small business activity in distressed communities using variables like business formation and survival, revenue, and employment. Among other studies, a 2017 report by the U.S. Small Business Administration found that low-income areas contain fewer small businesses overall, and that those businesses tend to employ fewer workers and generate smaller payrolls.⁴ More recently, researchers have also used transaction-based measures to assess small business activity. An August 2026 report from the National Bankers Association uses data on transaction size and volume—among other indicators—to track post-pandemic small business recovery in communities served by Minority Depository Institutions.⁵ We build on this literature by using depersonalized Visa transaction data to examine the activity of small businesses in economically distressed and non-distressed areas.⁶ Specifically, we examine business activity along four dimensions: e-commerce adoption, average transaction size, annual transaction volume, and merchant density.
In addition to leveraging novel indicators of small business activity, we use a unique proxy for economically distressed geographies: Community Development Financial Institution investment areas (hereafter “CDFI areas”). These areas are census tracts that meet one or more distress criteria including poverty rate, median family income, unemployment rate, and population loss.⁷ The U.S. Department of the Treasury uses these areas to help certify CDFIs, a formal designation for mission-driven banks, credit unions, and other financial institutions that share a common goal of expanding economic opportunity in low-income U.S. communities.⁸ The combination of indicators used to identify CDFI areas makes these areas a meaningful proxy for overall economic distress, uniting multiple dimensions of community wellbeing beyond income or unemployment alone.
Using 2025 data from over 30,000 U.S. ZIP codes representing all 50 states and the District of Columbia, we find that small businesses operating in CDFI areas exhibit lower e-commerce adoption, smaller average transaction size, and lower merchant density.⁹ By contrast, we find that small businesses in CDFI areas process a greater annual number of transactions on average. After covering each of these findings in turn, we discuss possible mechanisms and other implications.
Small businesses in CDFI areas exhibit lower e-commerce adoption
Small businesses that sell their products and services online enjoy a variety of benefits. Past Visa Economic Empowerment Institute (VEEI) research has found that participation in e-commerce is associated with higher revenue for small business and greater resilience to economic shocks.¹⁰ As a proxy for e-commerce adoption, we use the share of small business payment volume composed of card-not-present (CNP) transactions. While card-present (CP) transactions involve tapping, swiping, or inserting a physical card at a payment terminal, CNP transactions occur remotely. Figure 1 displays the median CNP share of payment volume processed by small businesses in U.S. ZIP codes in 2025, segmented by CDFI status and population density. We include population density to help account for differences in structural conditions and challenges that small businesses may face in rural and urban areas.11, 12
Figure 1: Median small business CNP share in U.S. ZIP codes by CDFI status and population density, 2025
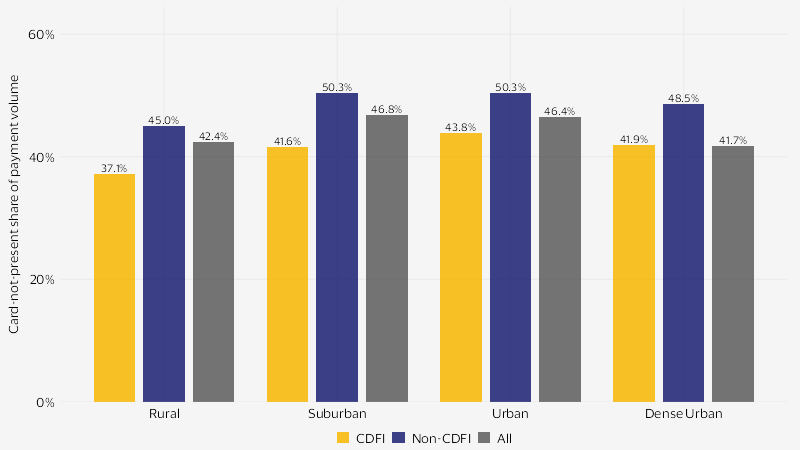
Across a majority of the ZIP code groups analyzed, CNP transactions represent just under half of total payment volume. Suburban ZIP codes exhibit the highest overall CNP share with a median of 46.8 percent, while dense urban ZIP codes exhibit the lowest share at 41.7 percent. Across all four population density categories, CDFI areas exhibit lower CNP share at small businesses than non-CDFI areas. This gap is largest in rural ZIPs, where the median CNP share is 37.1 percent in CDFI areas and 45 percent in non-CDFI areas—a relative difference of 21.3 percent. These results suggest that while e-commerce adoption at small businesses is lowest overall in dense urban areas, the e-commerce gap between distressed and non-distressed ZIPs is widest in rural areas. Several factors may contribute to these differences, including business composition, customer behavior, and other local economic factors. We revisit these mechanisms in subsequent sections.
Transaction size and volume: Two different stories
Next, we examine two complementary measures of small business activity: average transaction size and annual number of transactions.
Figure 2: Median small business transaction size in U.S. ZIP codes by CDFI status and population density, 2025
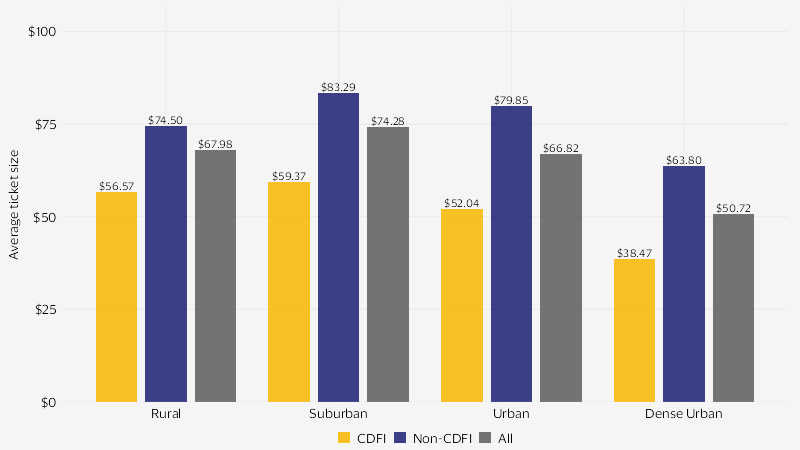
Figure 3: Median small business transaction volume in U.S. ZIP codes by CDFI status and population density, 2025
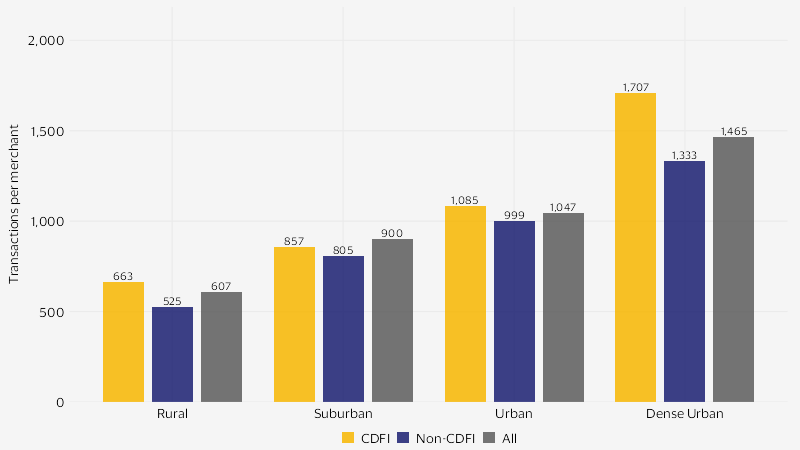
Figure 3 displays the median number of transactions processed by small businesses in U.S. ZIP codes in 2025, segmented by CDFI status and population density. In both CDFI and non-CDFI areas, annual transaction volume appears to increase with population density. While the median number of transactions processed by small businesses in rural ZIPs in 2025 was 607, the median for dense urban ZIPs was 1,465. Across population densities, we find that small businesses located in CDFI areas exhibit higher annual transaction volume than those in non-CDFI areas. Given our results on e-commerce adoption and transaction size, this finding runs contrary to our expectations.
Additionally, our results indicate that the gap in transaction volume is wider in areas with the highest and lowest population density, and narrower in areas with moderate population density. While the relative difference between CDFI and non-CDFI areas falls between 20 and 22 percent in rural and dense urban ZIPs, suburban and urban ZIPs exhibit relative gaps between six and eight percent. As in the case of e-commerce, these findings may be driven by a variety of factors—including merchant density—which we explore in the following sections.
The role of merchant density
One partial explanation for the higher number of annual transactions captured by small businesses in CDFI areas may be reduced merchant density. In other words, in areas with fewer total small businesses for every resident, we expect the existing businesses to capture a greater number of annual transactions. The results are directionally consistent with this explanation, although they do not rule out additional factors like industry composition and consumer spending behavior.
Figure 4: Median small business density in U.S. ZIP codes by CDFI status and population density, 2025
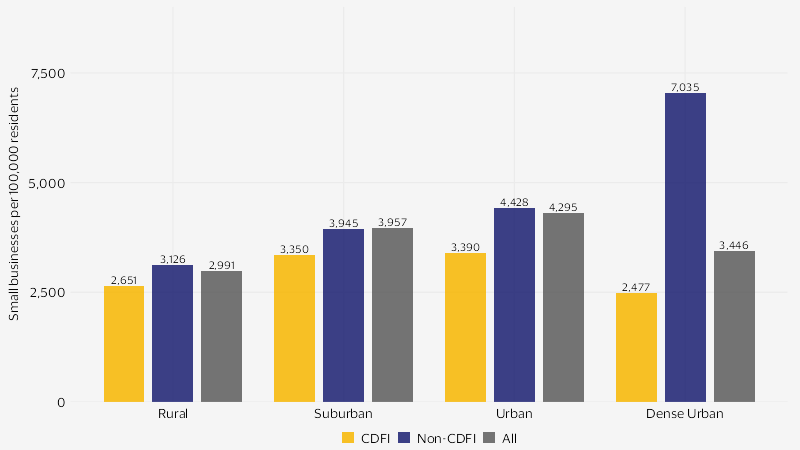
Figure 4 displays the median number of small businesses per 100,000 residents in U.S. ZIP codes in 2025, segmented by CDFI status and population density. Urban ZIP codes exhibit the highest overall small business density, with a median of 4,295 businesses per 100,000 residents, while rural ZIP codes exhibit the lowest density at 2,991 businesses. Like our findings on e-commerce adoption and transaction size, CDFI areas exhibit lower merchant density across all population densities. This gap is especially pronounced in dense urban areas, where the median small business density is 2,477 in CDFI ZIPs and 7,035 in non-CDFI ZIPs—a relative difference of 184 percent. Compare this to the relative gap in rural areas, which is nearly ten times narrower at only 17.9 percent. Given the similar relative gap in transaction volumes between CDFI and non-CDFI ZIPs in rural and dense urban areas, our findings suggest that merchant density may help to explain some of this variation, but it does not tell the entire story.
Discussion and conclusion
This descriptive study has examined small business activity in economically distressed communities using depersonalized Visa transaction data from over 30,000 U.S. ZIP codes. As a proxy for economic distress, we use CDFI investment areas for their incorporation of multiple distress indicators. With this novel approach, our results suggest that small businesses in economically distressed areas exhibit lower e-commerce adoption, smaller average transaction size, and lower merchant density (i.e., fewer small businesses per resident). These gaps persist across population densities, though they vary in magnitude. In the case of e-commerce adoption, the difference between distressed and non-distressed ZIPs is widest in rural areas. For transaction size and merchant density, the gaps are most pronounced in dense urban areas.
Our findings on annual transaction volume paint a different picture. In contrast to our other findings, small businesses in CDFI areas appear to process more transactions annually than those in non-CDFI areas across all population densities. Although our results are not sufficient to establish causality, we suspect that the elevated transaction volume observed in distressed areas may result in part from reduced merchant density. With fewer small businesses per resident, existing businesses may capture a greater number of annual transactions. Still, this explanation does not fully account for the observed differences in transaction volume.
Several other factors may contribute to the patterns described in this study. Existing research finds that small businesses operating in low-income communities are disproportionately concentrated in certain industries.¹³ Moreover, recent studies find that low-income consumers exhibit meaningful differences in their spending behavior and choice of payment instruments.¹⁴ Like merchant density, these differences in consumer behavior and industry composition may help to explain the gaps in e-commerce adoption, transaction size, and transaction volume that we observe in distressed communities.
The nature of these gaps also differs across rural and urban areas. While dense urban areas exhibit the lowest overall e-commerce adoption rates, rural areas exhibit a wider gap between distressed and non-distressed ZIP codes. In rural communities, the compounding effect of limited access to digital infrastructure may help explain the wider e-commerce gap we observe. Research from the Federal Reserve Bank of Cleveland highlights the challenges rural businesses face in accessing wired internet and acquiring digital skills—barriers that may limit their ability to sell online.¹⁵ By contrast, small businesses in dense urban areas—which exhibit the widest gaps in merchant density and transaction size—likely face a different set of obstacles to e-commerce adoption.
Our findings illustrate how payment activity varies by population density and economic distress, giving policymakers, financial institutions, researchers, and entrepreneurs clearer insight into the local conditions affecting small businesses and opportunities for growth.
Endnotes
- U.S. Small Business Administration Office of Advocacy. (2026, February 3). Frequently Asked Questions About Small Business 2026.
- Morris, M. H., & Tucker, R. (2020, April 9). Poverty and Entrepreneurship in Developed Economies.
- U.S. Department of the Treasury. (2025, January). Financing Small Business: Landscape and Policy Recommendations.
- Kugler, M., Michaelides, M., & Agbayani, C. (2017, September). Entrepreneurship in Low-Income Areas.
- Barr, A., Pietro, E., & Thorne-Harris, C. (2026). 2020-2025: Exploring MDI Communities and Small Business Sales Activity.
- Data include transactions made on credit, debit, and prepaid cards. For the purposes of this study, we define small businesses as those that process less than $2.7 million in annual payment volume with at least five total transactions.
- CDFI Fund. (n.d.). Can any geography be designated as an investment area?
- CDFI Fund. (n.d.). What are CDFIs?
- The United States Post Office reports 41,554 U.S. ZIP codes, with our sample reflecting 72.4 percent of this total. Because CDFI Investment Areas are designated at the census tract level, we mapped census tracts to ZIP codes to align the designation with our ZIP-level payment data. We classify ZIP codes as “CDFI areas” if all census tracts within the ZIP code are CDFI-designated investment areas, and as “non-CDFI areas” if none of the census tracts within the ZIP code are CDFI-designated. ZIP codes containing both designated and non-designated census tracts are excluded from this classification. The number of ZIP codes in each group is as follows: 5,999 CDFI (20.0 percent), 11,155 non-CDFI (37.1 percent), and 12,914 other (42.9 percent).
- VEEI. (2022, April). Dubai SMEs: Digital and resilient; VEEI. (2022, August). Digital, diverse, and going global: A new dawn for women-led firms.
- Federal Reserve Banks, Small Business Credit Survey. (2026). 2026 Firms in Focus: Chartbook on Rural and Urban Firms.
- We classify “rural” ZIP codes as those with 0 to 99 residents per square mile, “suburban” as those with 100 to 999 residents, “urban” as those with 1000 to 3499 residents, and “dense urban” as those with 3500 or greater. The number of ZIP codes in each group is as follows: 19,232 rural (64.0 percent), 6,650 suburban (22.1 percent), 3,364 urban (11.2 percent), and 822 dense urban (2.7 percent).
- Kugler, M., Michaelides, M., & Agbayani, C. (2017, September). Entrepreneurship in Low-Income Areas; Meltzer, R., & Schuetz, J. (2011, December 27). Bodegas or Bagel Shops? Neighborhood Differences in Retail and Household Services.
- Akana, T. (2025, November). Evidence of Diverging Spending Behavior by Income; Greene, C., Stavins, J., & Perry, J. (2024). Consumer Payment Behavior by Income and Demographics.
- Zhao, L. (2023, August 7). How the Digital Divide Affects America’s Rural Small Businesses.