
Stablecoins are often described as some of the fastest moving instruments in digital finance. Tokens can be transferred globally, settle almost instantly, and circulate continuously on public blockchains. As a result, there has been growing interest in stablecoin velocity as a way to assess their economic relevance. But speed alone does not provide the full picture; there are other questions that need to be addressed: are we measuring stablecoin velocity correctly, and does it translate into real economic impact?
In traditional monetary economics, velocity refers to how frequently money changes hands in the economy. The most common measure is M1 velocity, calculated as nominal GDP divided by the M1 money supply, which includes cash and checking deposits.¹ Put simply, M1 velocity measures how often a dollar is used to purchase goods and services over a given period. It is therefore best understood as a measure of retail money velocity, closely tied to everyday consumption and payment activity rather than financial market transactions.
Stablecoin velocity and the limits of retail comparisons
This distinction becomes important when comparing M1 to stablecoins. Unlike cash and deposits, stablecoins can be used for both retail payments and wholesale financial activity, including trading, settlement, and liquidity management. Additionally, since stablecoins are issued and transacted on public blockchains, the velocity of stablecoins can be more precisely measured by dividing the total transaction volume by the outstanding supply of stablecoins.
Figure 1 compares U.S. M1 velocity with stablecoin velocity using quarterly data. M1 velocity data comes from the Federal Reserve Bank of St. Louis, while stablecoin velocity is calculated using data from Visa’s Onchain Analytics Dashboard.² In the fourth quarter of 2025, M1 velocity stood at 1.65, meaning each dollar circulated about 1.65 times through the economy. Over the same period, stablecoin velocity was 13.56, indicating that the average stablecoin token changed hands more than thirteen times.
Figure 1: Velocity of M1 vs. Total stablecoin transactions
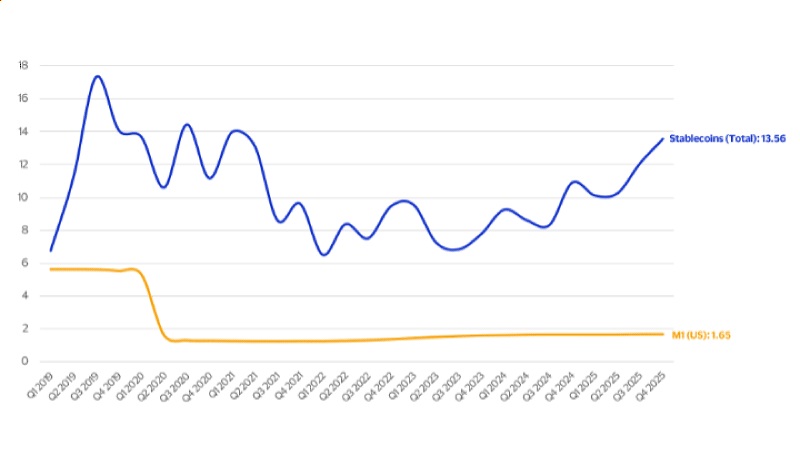
At first glance, this gap suggests that stablecoins may be far more economically active than traditional money. However, this comparison reflects important differences in underlying activity. M1 velocity reflects retail spending on goods and services, while stablecoin velocity largely captures financial system activity. The majority of stablecoin transactions today are related to investments, trading, settlement, and funding rather than consumer purchases. As a result, the chart does not compare like with like: it contrasts retail money velocity with what is effectively wholesale or financial system velocity.
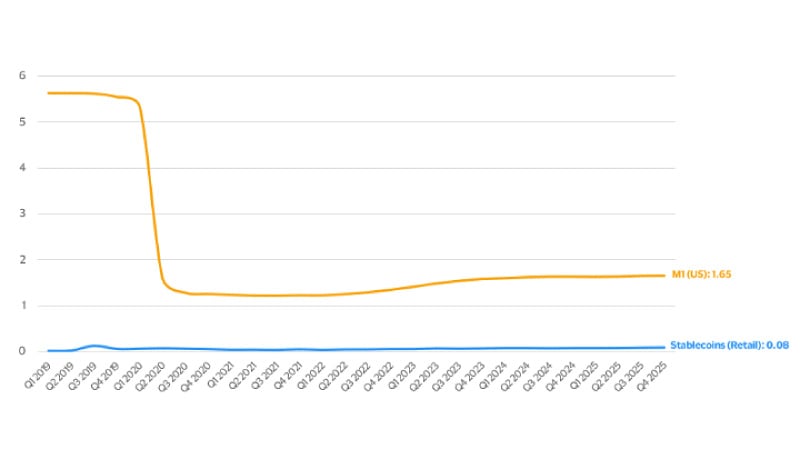
To better align the two measures, one approach is to focus on stablecoin transactions that resemble retail payments. Unfortunately, there is no reliable way to determine whether an on‑chain transaction corresponds to a purchase of goods or services (as opposed to an investment in a cryptocurrency, for example). Instead, industry practice has converged on using stablecoin transactions of $250 or less as a proxy for retail payments. Using this filter, Figure 2 compares M1 velocity with “retail” stablecoin velocity. In the fourth quarter of 2025, while M1 velocity remained at 1.65, retail stablecoin velocity was just 0.08, suggesting that stablecoin usage for everyday purchases remains limited.
Figure 2: Velocity of M1 vs. “Retail” stablecoin transactions
A financial-system benchmark for stablecoins
This result is informative, but it also raises a limitation. Retail‑sized stablecoin transactions represent less than 1 percent of total stablecoin activity. Focusing exclusively on this subset risks understating where stablecoins are actually being used today. If stablecoins primarily facilitate financial transactions rather than consumer spending, then a retail benchmark like M1 may not be the most appropriate point of comparison.
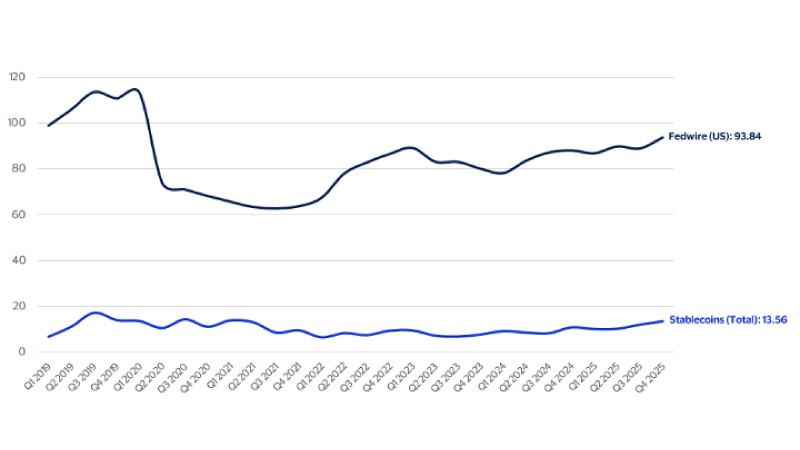
An alternative is to compare total stablecoin velocity with a measure that captures broader financial‑system turnover. For the U.S., one such proxy is Fedwire, the Federal Reserve’s wholesale payment system. By comparing the total value of Fedwire transactions with the average reserve balances held at the Federal Reserve, we can construct a measure of financial‑system velocity that reflects trading, settlement, and funding activity.³ While not perfectly analogous, this approach is conceptually closer to what total stablecoin transaction volume currently represents.
Figure 3 presents this comparison. In the fourth quarter of 2025, total stablecoin velocity was 13.56, while Fedwire velocity was 93.84. This comparison places stablecoins in clearer context. Although stablecoins have grown rapidly and exhibit meaningful financial activity, they currently operate at a smaller scale than established systems, such as Fedwire.
Figure 3: Velocity of Fedwire transactions vs. Total stablecoin transactions
Conclusion
Overall, these comparisons show that the economic impact of stablecoins depends heavily on how velocity is defined. From a retail perspective, stablecoin activity represents a small share of everyday economic transactions. From a financial‑system perspective, stablecoins show higher velocity and growing relevance, but their scale remains modest compared with established infrastructure like Fedwire. Understanding this distinction is essential for interpreting stablecoin data—and for assessing where their true economic impact may ultimately lie.
Footnotes:
- The Federal Reserve Bank of St. Louis provides helpful information and historical data on M1 velocity in the United States, through its Federal Reserve Economic Data (or FRED) website.
- Total transaction volume and outstanding stablecoin supply data are available at Visa’s Onchain Analytics Dashboard.
- Total monthly transfer values originated over Fedwire and total depository institution reserves captured by the Federal Bank of St. Louis are used to calculate this metric.