
Overview
The acceleration of digitalization around the globe has continued to transform various sectors, driving innovation and consumer convenience. In the payments sector, more accessibility has enabled greater adoption of digital payment services. Advancements in technology also have enabled increasingly fast and secure ways to pay.
The Global Findex Database 2025, which the World Bank released in July, confirms that the use of financial services is on the rise, driven largely by greater access to and use of accounts¹ enabled by technology. Launched in 2011 and updated every three years, the Global Findex database collects worldwide survey data to create a comprehensive database of indicators on how people save, borrow, make payments, and manage risk using financial services. The database provides valuable insights into trends in financial inclusion and opportunities to expand financial access.
Access and use of digital financial services expanding
More adults throughout the world are connected to the formal financial system than ever before. According to the latest Findex, 79 percent of adults have an account with a bank, financial institution, or mobile money provider, up from 74 percent in 2021, and 51 percent in 2011. This growth is even more pronounced in low- and middle-income economies, where account ownership grew by 11 percentage points in low-income economies and eight percentage points in lower middle-income economies between 2021 and 2024 (Figure 1). Mobile phones and internet connectivity are allowing more people to access and use digital financial services and are driving the growth of account ownership in low- and middle-income economies.
Figure 1: Account Ownership, 2011-2024
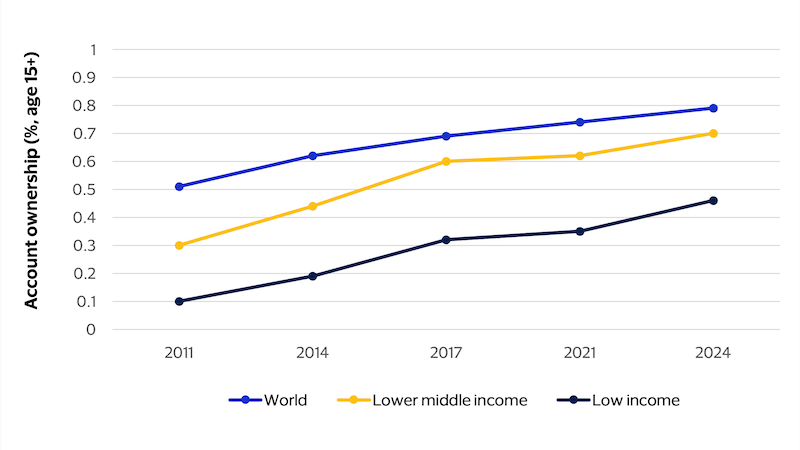
Source: Findex data
A welcome development is that beyond simply having an account with a financial institution or mobile money provider, more adults are using those accounts in their daily lives. Digital payments, versus saving and borrowing, are the most used formal financial service. In 2024, 61 percent of adults, or 82 percent of account owners, in low and middle-income economies made or received digital payments, an increase of 27 percentage points from 2014. Furthermore, in 2024, 42 percent of adults worldwide made a digital payment to a merchant, up from 35 percent in 2021. Despite this progress, however, gaps remain. According to the Findex report, women are disproportionately less likely than men to have accounts, and poorer adults continue to face the most challenges to financial access.
Gaps between financial wellbeing and access remain
Despite high levels of account ownership (79 percent) and access to digital payments (67 percent), overall financial health – which is defined as the ability to pursue financial goals, manage financial emergencies, and feel confident about one’s finances – has not improved from previous years.
A key aspect of financial health is financial confidence, understanding how to use financial accounts properly and confidently. Consumers use financial products that they trust and understand, meaning that financial confidence correlates to the adoption of digital financial products and services. The 2025 Findex reports that a lack of financial confidence can discourage adults who do not have accounts from opening one. When surveying adults without a formal financial account, between 33 and 59 percent of people across regions said they would need help using a formal financial account if they were to open one. The lack of financial confidence is even more pronounced across gender and economic lines. In Europe and Central Asia, the Middle East and North Africa, and South Asia, women are at least 19 percentage points more likely than men to say they would need help using their account if they were to open one. Holistically, in low- and middle-income economies, two-thirds of people would require assistance.
Considerations for policymakers
Despite progress in growing access and usage of digital financial services, more work needs to be done to translate these gains into tangible improvements in financial inclusion and financial health. First, policymakers and industry should work together to improve financial literacy. Knowledgeable consumers are confident, and improving confidence leads to behavior change. As an example, Canada offers financial education in schools, and the initiative is reinforced by the Financial Consumer Agency of Canada’s National Strategy for Financial Literacy. Most Canadian banks allow children to open an account, either with their parents from any age or independently from age 13. Canada has one of the highest levels of financial literacy and digitization of payments globally, with 68 percent of adults who are financially literate and digital payments accounting for 86 percent of total payment volume.
Second, behavioral changes can be deployed to instill informed financial habits. The 2025 Findex shows that most people with accounts who exclusively make cash payments to merchants continue to use cash payments out of habit. To shift cash-paying behavior, there needs to be clear evidence of the benefits of digital payments. These become evident when digital payments are accepted in stores, online, and embedded in mobile applications, as transaction speeds increase and security is enhanced, emphasizing why promoting digital acceptance among merchants is critical. Government and industry working together can foster a vibrant ecosystem of digital infrastructure that supports consumers and merchants alike. For example, in 2017, the Polish government and key market players launched the Cashless Poland Initiative to improve electronic payment acceptance for businesses. As a result of the activities and investments of the public-private partnership, Poland rose to seventh place in Europe, up nine spots, in number of payment terminals per 1,000 residents, and the share of cashless payments in Poland increased over 26 percent from 2017 to 2024.
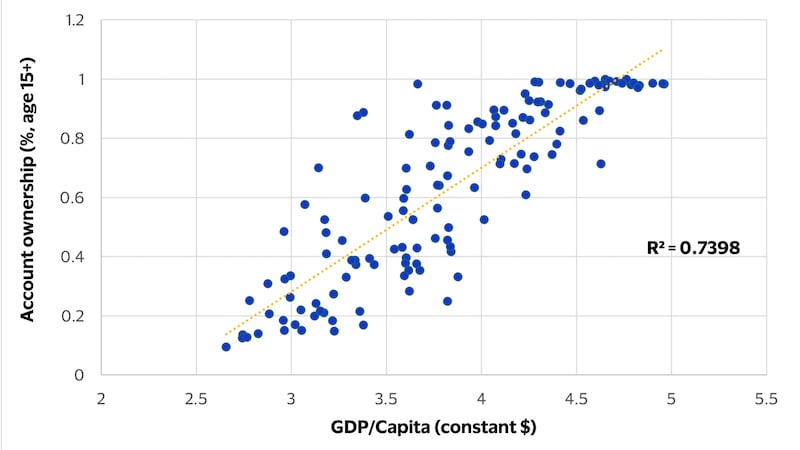
Policymakers should also consider evaluating the impacts of rapidly expanding access to certain digital financial services. Based on 2025 Findex data analysis, there appears to be a difference in correlation between GDP per capita and financial institution (FI) accounts compared to the correlation between GDP per capita and any account (Figures 2 and 3). This may suggest that financial service providers with restricted product offerings do not generate significant positive spillover effects for the broader economy, a phenomenon also observed in prior research.² Additionally, considerations should be made for developing policies and financial products that are tailored to the needs and behaviors of specific segments that may create better economic outcomes.
Figure 2: GDP/Capita and FI Account Ownership, 2024
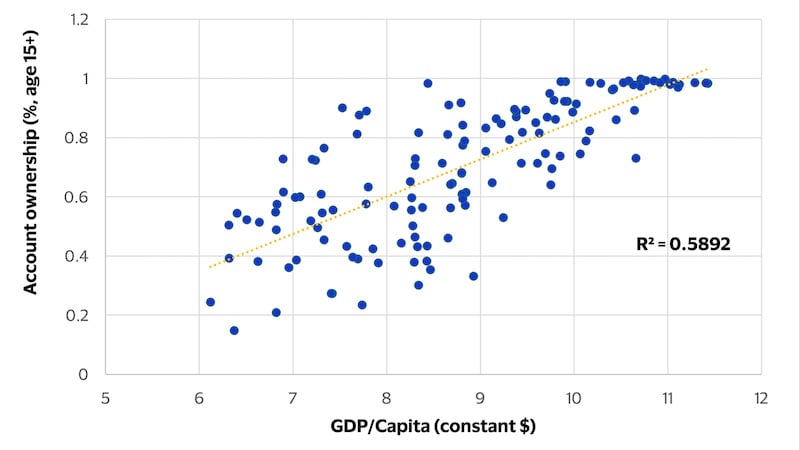
Figure 3: GDP/Capita and Any Account Ownership, 2024
- Accounts refers to the indicator “Account (%, age 15)” that is defined as the percentage of respondents who report having an account (by themselves or together with someone else) at a bank of similar financial institution or report personally using a mobile money service in the past year.
- Adeline Pelletier, Susanna Khavul, and Saul Estrin, "Innovations in emerging markets: the case of mobile money,” Industrial and Corporate Change, 2020, Vol. 29, No. 2, 395-421.