
The recent passage of comprehensive stablecoin regulatory frameworks—most notably the European Union’s Markets in Crypto Assets Regulation (MiCA‑) and emerging federal legislation in the United States (GENIUS)—has reduced regulatory uncertainty surrounding the issuance of fiat-backed stablecoins and provided ‑long awaited clarity to market participants. These regimes establish‑ explicit requirements regarding permissible reserve assets, redemption rights, liquidity management, and issuer oversight, thereby transforming stablecoins from largely unregulated financial instruments into governed payment mechanisms.¹
With the regulatory perimeter now more clearly defined, a central question facing stablecoin issuers is not only legal permissibility, but also economic feasibility. In particular, reserve composition requirements reshape the risk-return-liquidity tradeoffs available to issuers, reducing the range of reserve strategies while emphasizing redemption certainty, asset quality, and liquidity. To analyze how these requirements affect the expected return and liquidity profile of stablecoin issuers in the U.S. and Europe, this report applies an efficient frontier framework, providing a quantitative lens through which to assess the sustainability and strategic implications of regulated stablecoin business models. Under both GENIUS and MiCA, regulation changes not only expected returns, but also the shape of the efficient frontier itself, shifting reserve management away from broader portfolio optimization and toward what is, in effect, a more liquidity-engineered model.² However, it should be stated that this report does not seek to assess whether one regulatory framework is preferable to another; rather, it presents a stylized, model‑based analysis intended to illustrate how different reserve asset requirements—combined with prevailing market conditions—can shape the quantitative risk‑return tradeoffs facing stablecoin issuers.
The discussion begins with a brief overview of efficient frontier models, explaining how they are used to evaluate trade‑offs between return and risk and why they are a useful lens for analyzing stablecoin reserve management. It then turns to the pre‑regulatory environment, using the reserve composition of Tether’s U.S. dollar-denominated stablecoin (USDT) as a practical proxy for how some stablecoin issuers optimized returns before explicit regulatory guidance was introduced. Building on this baseline, the analysis examines how the efficient frontier changes under the GENIUS framework in the United States, highlighting how permissible asset restrictions reshape issuer economics. A parallel analysis is then conducted for Europe under MiCA, where liquidity and safeguarding requirements impose a distinctly different set of parameters. The post concludes by comparing these regimes and summarizing what the resulting shifts in the efficient frontier imply for the future business models of stablecoin issuers.
Introducing efficient frontier models
Efficient frontier models are a portfolio optimization framework used to identify the best possible combinations of risk and return across a set of assets. They visually and mathematically describe the relationship between expected return and portfolio risk, typically measured by volatility. Introduced by Harry Markowitz in 1952 as part of Modern Portfolio Theory (MPT), efficient frontier models provide a structured way to evaluate how different asset allocations perform relative to one another and to distinguish optimal portfolios from suboptimal ones.³
At the core of the model is the idea that, for any given level of expected return, there exists a portfolio with the lowest achievable level of risk.⁴ Portfolios that meet this criterion form the “efficient frontier,” a curve representing optimal risk‑return trade‑offs. Portfolios that fall below this curve are considered inefficient, meaning they take on more risk than necessary for the return they generate, while portfolios above the frontier are unattainable given the available assets and assumptions.
Efficient frontier models are constructed using historical data to estimate each asset’s expected return, volatility, and correlation with other assets. An optimization engine then evaluates thousands of potential portfolio combinations, calculating their expected risk and return. By systematically varying asset weights, the model identifies portfolios that minimize risk for a given return, or equivalently maximize return for a given level of risk. A key insight of the framework is the power of diversification: combining assets that are not perfectly correlated can materially reduce overall portfolio risk without proportionally reducing expected returns.
These models are widely used because they support clear, disciplined decision‑making. Portfolio managers can assess how adding or removing assets affects overall risk and return, compare existing portfolios to optimal benchmarks, and design allocations that align with different risk tolerances. While the models rely on assumptions and estimates, they remain a foundational tool for understanding trade‑offs, improving diversification, and constructing portfolios in a transparent and defensible way.
This framework is particularly useful for analyzing stablecoin reserve management under new regulatory regimes. Stablecoin issuers face a constrained asset universe, explicit liquidity and redemption requirements, and limited tolerance for risk, all of which naturally lend themselves to a portfolio optimization lens. By applying efficient frontier analysis, it becomes possible to quantify how regulatory restrictions reshape the set of feasible reserve portfolios, compress expected returns, and alter the trade‑off between yield and liquidity. In this context, the efficient frontier helps translate regulatory rules into economic outcomes, providing a clear way to compare issuer business models before and after the introduction of stablecoin regulation.
Assessing stablecoin reserve management before regulations
To understand how regulation changes the economics of stablecoin issuance, it is useful to first imagine a world in which no explicit regulatory framework exists. In this hypothetical setting, a stablecoin issuer acts much like a portfolio manager: the primary objective is to preserve capital and maintain liquidity to meet redemptions, but there is also a clear incentive to generate incremental return on reserve assets wherever possible. Without formal restrictions on eligible assets, an issuer could allocate the bulk of reserves to high‑quality liquid instruments while still dedicating a smaller portion of the portfolio to higher‑return, higher‑volatility assets to improve overall portfolio yield.
Even in the absence of regulation, practical constraints remain. A stablecoin issuer cannot take unlimited risk without undermining confidence in the peg, so responsibly managed reserve portfolios would still be anchored by assets such as bank deposits, money market funds, short-dated government securities, and other instruments that can be liquidated quickly under stress. However, absent regulatory guardrails, nothing would prevent an issuer from supplementing this core with riskier assets—such as corporate credit or alternative stores of value—if doing so meaningfully improved expected returns.
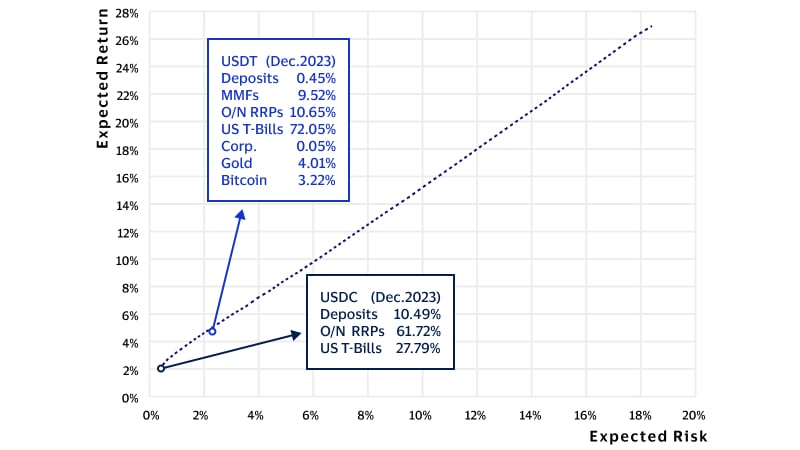
As a proxy for the reserve universe without regulatory guidance, this analysis uses the asset composition disclosed in Tether’s December 2023 USDT reserves report.⁵ At that time, Tether’s reserves included a mix of bank deposits, money market funds, overnight reverse repurchase agreements, U.S. Treasury bills, corporate bonds, gold, and bitcoin. Together, these assets span a broad range of risk, liquidity, and return characteristics, making them a useful stand‑in for how a stablecoin issuer might allocate capital in a largely unregulated environment.
Monthly historical data for each asset class over a five‑year period, from January 2019 through December 2023, was used to estimate returns, volatility, and correlations and to construct an efficient frontier. Bank deposits are proxied using the Secured Overnight Financing Rate (SOFR), while market prices and yields for the remaining assets were drawn from publicly available sources.⁶ It should be noted that some asset categories disclosed by Tether—including “Other Investments” and “Secured Loans”—were excluded from the analysis due to the lack of consistent historical data, and therefore do not appear in the frontier.
The resulting efficient frontier, shown in Figure 1, illustrates the wide range of risk‑return combinations available when reserve composition is unregulated. To provide additional context, the chart also plots the actual reserve portfolios of USDT (Tether) and USDC (Circle) as of December 2023, based on public issuer disclosures.⁷ This makes it possible to see where real‑world stablecoin reserve strategies fell relative to the efficient frontier prior to the introduction of comprehensive regulation, and sets a baseline against which the impact of GENIUS in the United States and MiCA in Europe can be evaluated in the sections that follow.
Figure 1: Efficient frontier model without regulatory guidance
How GENIUS reshapes the stablecoin efficient frontier in the U.S.
With a pre‑regulation baseline established, we can now examine how the introduction of the GENIUS Act reshapes the efficient frontier for U.S.‑based stablecoin issuers. GENIUS narrows the set of permissible reserve assets, prioritizing liquidity and risk management over yield optimization. From a portfolio construction perspective, this has immediate and quantifiable implications for the risk‑return trade‑offs available to issuers.
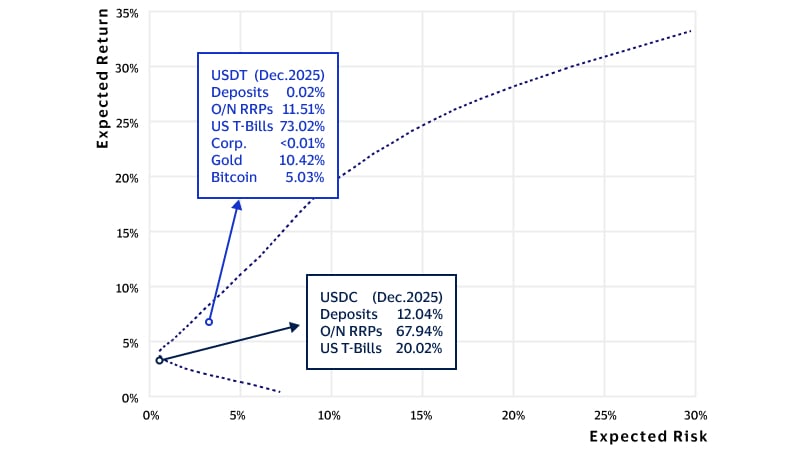
Figure 2 below re-estimates the efficient frontier using the same asset universe described in the previous section—bank deposits, money market funds, overnight reverse repos, U.S. Treasury bills, corporate bonds, gold, and bitcoin—but updates the analysis using monthly historical data from January 2021 through December 2025. This figure also plots the USDT reserve portfolio, which includes a diverse set of assets such as corporate bonds, gold, and bitcoin.⁸ Due to the fact that efficient frontiers are effectively a snapshot in time and can change based on the different historical risks and returns, in the unregulated setting illustrated in Figure 2, the efficient frontier exhibits the familiar concave shape often predicted by modern portfolio theory. Notably, in this instance, portfolios with significant allocations to corporate bonds fall below the frontier, indicating that they are inefficient: for the same level of volatility, substantially higher expected returns could be achieved through alternative asset combinations. This outcome reflects both the correlation structure of corporate credit and the availability of higher returning assets during the period analyzed.
The same figure also plots the USDC reserve portfolio, which is fully compliant with GENIUS. Its position highlights a key tension introduced by the regulation.⁹ While USDC sits well within the feasible set of portfolios, its opportunity set is far more limited than that of an unregulated stablecoin like USDT because of the limited range of assets that GENIUS permits.
Figure 2: Efficient frontiers with and without GENIUS regulations
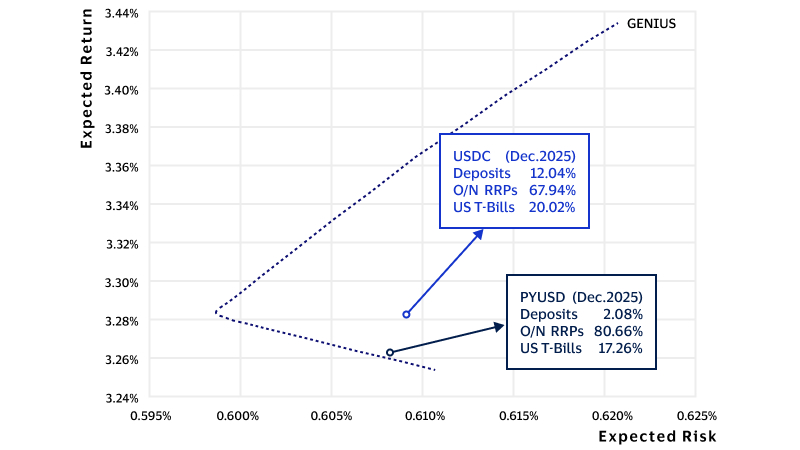
Indeed, this shift becomes even clearer in Figure 3 below, which isolates only GENIUS eligible assets—bank deposits, money market funds, overnight reverse repurchase agreements, and U.S. Treasury bills—and constructs a new efficient frontier based solely on this restricted universe. Because these assets all sit very close to one another in terms of yield and volatility, the resulting frontier is comparatively narrow. Across the entire efficient set, the difference between the lowest and highest return portfolios is less than 20 basis points.
Figure 3 also plots the reserve portfolios of both USDC and PYUSD (PayPal USD stablecoin, issued by Paxos) as of December 2025.¹⁰ As illustrated, neither portfolio lies exactly on the theoretical frontier, suggesting small inefficiencies relative to the model’s optimal allocations. However, given how compressed the GENIUS frontier is, these deviations are economically minor. In practice, both portfolios align closely with what the model would predict for issuers prioritizing liquidity, operational simplicity, and regulatory compliance over marginal yield gains.
Taken together, the two figures illustrate the central effect of GENIUS on stablecoin issuer economics: it does not merely shift the efficient frontier downward, but narrows it. The result is a reserve management framework that looks less like traditional portfolio optimization and more like liquidity engineering, with less differentiation in expected returns across compliant asset allocations.
Figure 3: Efficient frontier under GENIUS
Efficient frontier compression under MiCA
While GENIUS in the United States defines an explicit list of eligible reserve assets, MiCA takes a more principles-based approach. Rather than prescribing specific instruments, MiCA requires that stablecoin reserves be invested in high quality, liquid assets (HQLA) that are low risk, denominated in the same currency as the stablecoin, and structured to ensure continuous redemption at par. In practice, supervisory guidance and market expectations strongly favor assets such as bank deposits, short dated sovereign debt, money market like instruments, and other near cash exposures, but the absence of a fixed list introduces additional ambiguity for issuers attempting to optimize reserve portfolios.
The second—and arguably more consequential—difference is MiCA’s mandatory bank deposit requirement. All stablecoin issuers must hold at least 30 percent of total reserves in bank deposits, and that threshold increases to 60 percent once an issuer is designated “significant” based on factors such as issuance size or systemic relevance.¹¹ These allocation parameters materially reshape the efficient frontier by limiting how much capital can be deployed into higher‑yielding, albeit still low‑risk, instruments.
Because MiCA does not specify a definitive asset universe, constructing an efficient frontier requires making reasonable assumptions about what qualifies as “safe and liquid” in a European context. For the purposes of this analysis, the model includes bank deposits, 3‑month Euribor as a proxy for money market fund yields, the euro short‑term rate (€STR) as a proxy for overnight reverse repurchase agreements, and 3‑month sovereign debt issued by France and Germany.¹² These assets broadly mirror the risk profile of GENIUS‑eligible instruments, while reflecting the realities of euro‑denominated markets.
As shown in Figure 4 below, the resulting MiCA efficient frontier sits well below its U.S. counterpart. Expected returns across the MiCA frontier range from approximately 0.40 percent to 1.80 percent, compared to roughly 3.30 percent under GENIUS. This gap is driven primarily by lower underlying yields in euro money markets and sovereign debt, rather than by differences in portfolio construction. Even before considering allocation parameters, the European opportunity set is smaller.
MiCA’s bank deposit requirements further compress the feasible frontier. Because issuers must hold at least 30 percent of reserves in bank deposits, the upper‑right portion of the frontier—where portfolios would otherwise tilt more heavily toward higher‑yielding sovereign instruments—becomes inaccessible since investments in this part of the frontier would require holding less than 30 percent in bank deposits. For issuers designated as significant, the requirement to hold at least 60 percent in bank deposits tightens the investable universe further, effectively reducing the realistic expected return range to between 0.40 percent and roughly 1.00 percent. At that point, reserve optimization becomes less about portfolio construction and more about minimizing operational and liquidity frictions.
Figure 4: Efficient frontier under MiCA
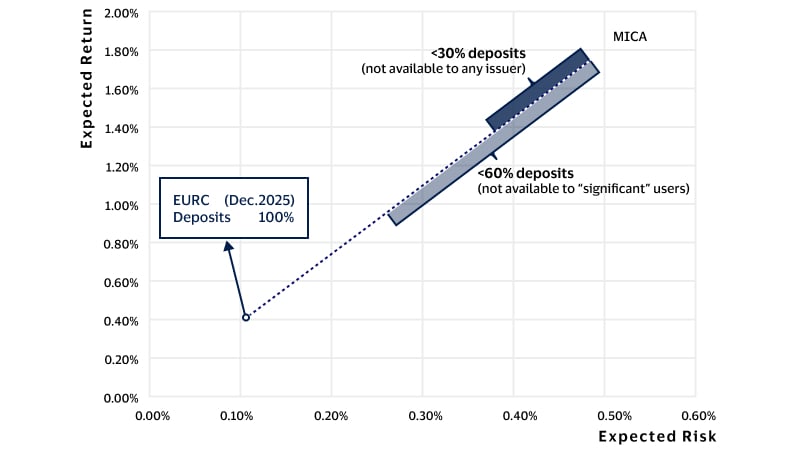
Figure 4 also plots the reserve portfolio of EURC, Circle’s euro denominated stablecoin. Notably, EURC reserves are held entirely in bank deposits.¹³ Given that EURC circulation stood at approximately €310 million as of December 2025, Circle was not required to exceed the 30 percent minimum deposit threshold and could, in principle, have allocated a portion of reserves to short dated sovereign debt to improve expected returns. The proxy used here for bank deposit yields—the ECB’s Corporates’ overnight interest rate—stood at just 52 basis points in December 2025, well below the roughly 2 percent yields available on other eligible assets. To the extent that Circle was able to negotiate materially higher rates on its actual bank deposits, holding reserves entirely in cash would be economically rational, particularly when combined with the superior liquidity profile of deposits relative to European sovereign bonds, which typically settle on a T+2 basis.
Taken together, the MiCA analysis highlights how regulatory design can shape not only risk tolerance, but the entire economic envelope within which stablecoin issuers operate. Compared to GENIUS, MiCA produces a lower and more limited efficient frontier, reinforcing a model in which stablecoin issuance in Europe increasingly resembles regulated payments infrastructure rather than a balance sheet driven financial business.
Conclusion
The analysis presented in this report shows that comprehensive stablecoin regulation does more than change the legal status of issuers—it reshapes the economics of issuance. By applying an efficient frontier framework, this report translates regulatory requirements into concrete tradeoffs among risk, liquidity, and return, illustrating how reserve rules affect issuer economics under both the U.S. and European regimes. Accordingly, differences in modeled outcomes across jurisdictions should be interpreted as the result of both regulatory design and underlying asset‑market environments, rather than as an evaluation of the relative merits of specific regulatory approaches.
Under GENIUS, the efficient frontier for U.S. issuers narrows into a band of outcomes centered on highly liquid, lower-risk reserve assets, limiting the role of portfolio optimization and reducing the scope for yield differentiation. MiCA produces an even more limited frontier, reflecting both the lower euro-area rate environment and the impact of required bank deposit allocations, particularly for issuers that may ultimately be designated as significant. In both frameworks, reserve management becomes less a question of return maximization and more a question of liquidity, resilience, and operational discipline.
These outcomes can be understood as a policy choice to emphasize safety, security, trust, clarity, and payment utility within the stablecoin ecosystem. In that sense, the compression of the efficient frontier is not simply a byproduct of regulation, but a reflection of a regulatory model that places greater weight on reserve quality, redemption confidence, and broader user protection than on issuer yield. While these requirements may reduce returns available from reserve portfolios, they may also support wider adoption by reinforcing confidence in regulated stablecoins as reliable instruments for payments and value transfer.
Taken together, these findings suggest that, in a more regulated market, competitive advantage is likely to depend less on reserve yield and more on core business fundamentals: technology, distribution, strategic partnerships, operational efficiency, risk management, compliance capabilities, and integration with existing payment systems. In that environment, stablecoin issuers are more likely to succeed based on the strength, trustworthiness, and utility of their platforms and networks than on the ability to generate incremental returns through riskier reserve strategies.
Footnotes:
- A detailed analysis of the requirements and the potential impact these regulations have on stablecoin issuers can be found in a recent report by the Visa Economic Empowerment Institute: How new regulations could potentially impact the future of stablecoins.
- The usage of “liquidity-engineered model” refers not to active market-making or liquidity deployment, but to the operational management of near-cash reserves under binding regulatory parameters.
- Markowitz, H. (1952). Portfolio Selection. The Journal of Finance 7(1).
- Markowitz, H. (1952).
- Tether. (2023, December). Consolidated Reserves Report.
- Since the actual interest a stablecoin issuer may earn on deposits it holds with financial institutions is not publicly available, and likely depends on the total amount of deposits, the SOFR rates is used as a helpful upper bound on the potential interest rate associated with bank deposits. Sources for the historical U.S. data used in the model can be obtained in the following the links: Secured Overnight Financing Rate, money market funds, overnight reverse repurchase agreements, U.S. Treasury bills, corporate bonds, gold, and bitcoin.
- Circle. (2023, December). USDC Reserve Report.
- Tether. (2025, December). Financial Figures & Reserves Report.
- Circle. (2025, December). USDC Reserve Report.
- Paxos. (2025, December). PYUSD Redemption Assets Report.
- Criteria for “significant” stablecoins for MiCA, include 1) more than 10 million stablecoin holders, 2) a market capitalization greater than €5 billion, and 3) an average number and aggregate value of daily transactions exceeding 2.5 million transactions and €500 million, respectively.
- Sources for the historical EU data used in the model can be obtained in the following the links: bank deposits, Euribor, euro short-term rate, French and German sovereign bills.
- Circle. (2025, December). EURC Reserve Report.